IPA 通路比较热图分析介绍


Comparison Analysis Pathways Heat Map
Why is the Canonical Pathway Heat Map useful? The Heat map allows you to visualize the enriched canonical pathways relevant to multiple analyses simultaneously and to find trends and clusters of pathway scores versus your analyses (i.e. “observations”).
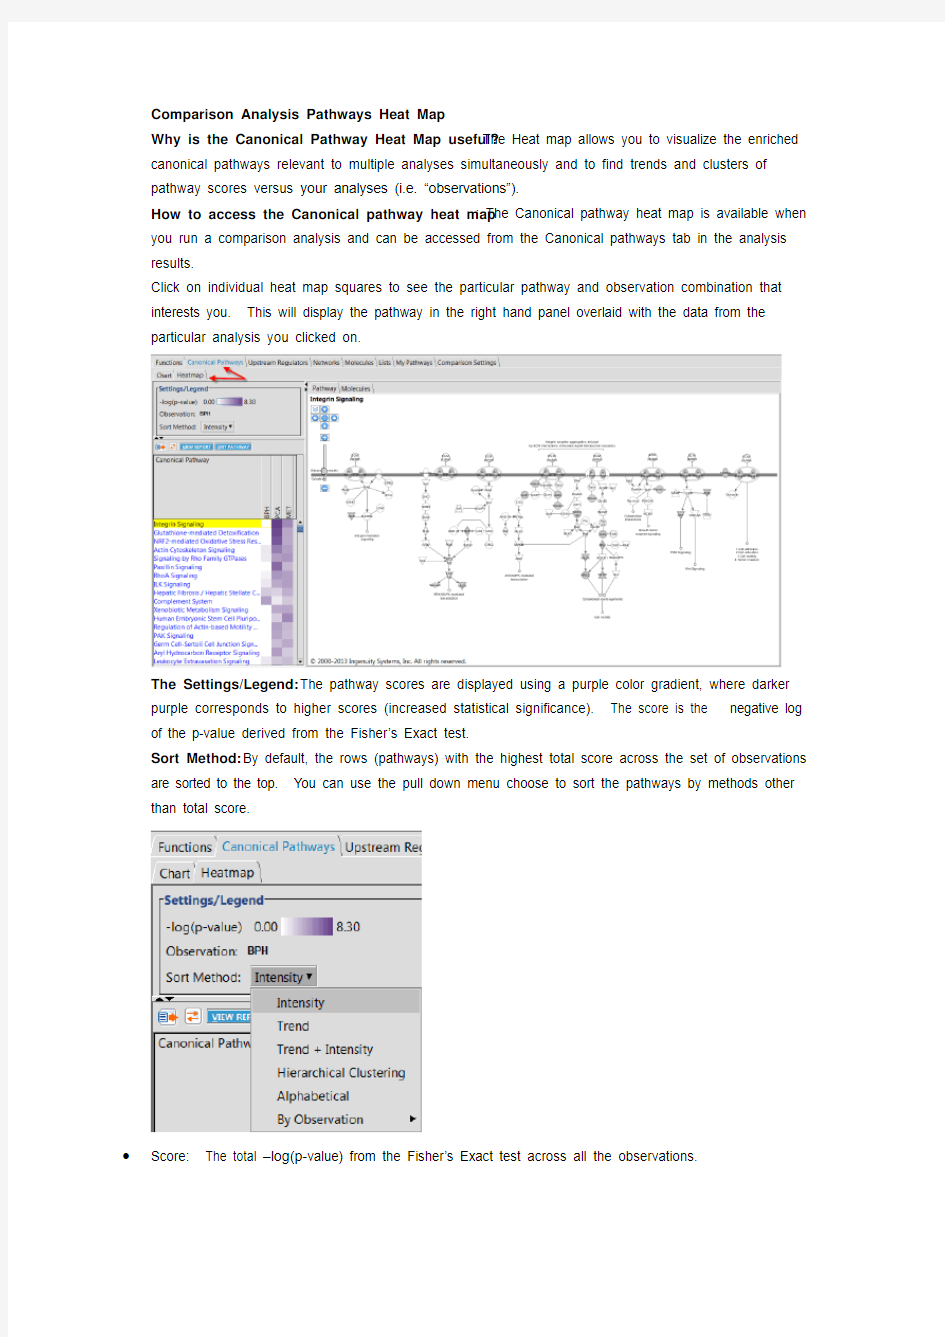
How to access the Canonical pathway heat map: The Canonical pathway heat map is available when you run a comparison analysis and can be accessed from the Canonical pathways tab in the analysis results.
Click on individual heat map squares to see the particular pathway and observation combination that interests you. This will display the pathway in the right hand panel overlaid with the data from the
particular analysis you clicked on.
The Settings/Legend: The pathway scores are displayed using a purple color gradient, where darker purple corresponds to higher scores (increased statistical significance). The score is the negative log of the p-value derived from the Fisher’s Exact test.
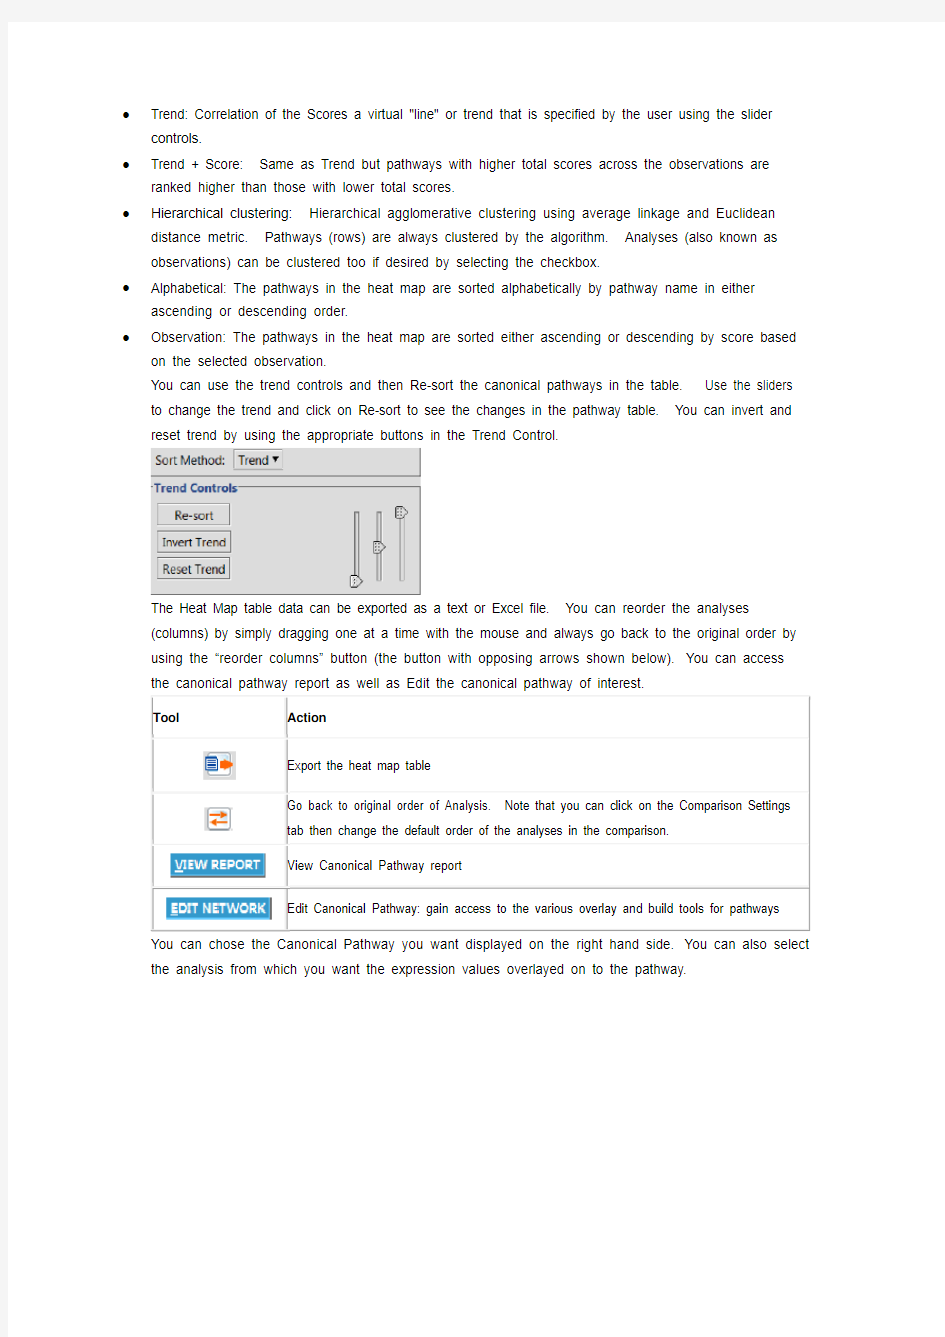
Sort Method: By default, the rows (pathways) with the highest total score across the set of observations are sorted to the top. You can use the pull down menu choose to sort the pathways by methods other than total score.
Score: The total –log(p-value) from the Fisher’s Exact test across all the observations.
?Trend: Correlation of the Scores a virtual "line" or trend that is specified by the user using the slider controls.
?Trend + Score: Same as Trend but pathways with higher total scores across the observations are ranked higher than those with lower total scores.
?Hierarchical clustering: Hierarchical agglomerative clustering using average linkage and Euclidean distance metric. Pathways (rows) are always clustered by the algorithm. Analyses (also known as observations) can be clustered too if desired by selecting the checkbox.
?Alphabetical: The pathways in the heat map are sorted alphabetically by pathway name in either ascending or descending order.
?Observation: The pathways in the heat map are sorted either ascending or descending by score based on the selected observation.
You can use the trend controls and then Re-sort the canonical pathways in the table. Use the sliders to change the trend and click on Re-sort to see the changes in the pathway table. You can invert and reset trend by using the appropriate buttons in the Trend Control.
The Heat Map table data can be exported as a text or Excel file. You can reorder the analyses
(columns) by simply dragging one at a time with the mouse and always go back to the original order by using the “reorder columns” button (the button with opposing arrows shown below).You can access the canonical pathway report as well as Edit the canonical pathway of interest.
Export the heat map table
Go back to original order of Analysis.
tab then change the default order of the analyses in the comparison.
View Canonical Pathway report
Edit Canonical Pathway: gain access to the various overlay and build tools for pathways the analysis from which you want the expression values overlayed on to the pathway.
You can select the Molecules tab to display the Molecules associated with the canonical pathway for that analysis.
Visualize the Canonical Pathway scores in the Heatmap in Comparison Analysis
A blue box now displays the pathway score (the –log10 of the Fisher’s Exact Test p-value) as you hover your mouse over a particular heat map square.
