2010年前美国(GDP)统计数据


2010年美国现价国内生产总值(GDP)统计数据
美国经济2011-01-29 08:40:57 阅读547 评论0 字号:大中小订阅
当地时间2011年1月28日上午8点30分,美国商务部经济分析局发布了2010年美国国内生
产总值数据。
数据显示,经历金融危机后,2010年美国实际国内生产总值较上年增长2.9%。
初步估算,2010年以现行价格计算,美国名义国内生产总值(GDP)为146602亿美元,较上年净增5412亿美元,同比增长3.8%;按2005年可比价格计算,实际国内生产总值为132487
亿美元,同比增长2.9%。
分季度同比来看,经季节调整后,各季度名义增长率为:一季度增长2.8%,二季度增长3.9%,三季度增长4.5%,四季度增长4.2%。各季度实际增长率为:一季度增长2.4%,二季度增长
3.0%,三季度增长3.2%,四季度增长2.8%。
分季度环比来看,各季度名义增长率为:一季度增长1.2%,二季度增长0.9%,三季度增长1.1%,四季度增长0.8%。各季度实际增长率为:一季度增长0.9%,二季度增长0.4%,三季度增长
0.6%,四季度增长0.8%。
分季度环比折年率来看,各季度名义增长率为:一季度增长4.8%,二季度增长3.7%,三季度增长4.6%,四季度增长3.4%。各季度实际增长率为:一季度增长3.7%,二季度增长1.7%,
三季度增长2.6%,四季度增长3.2%。
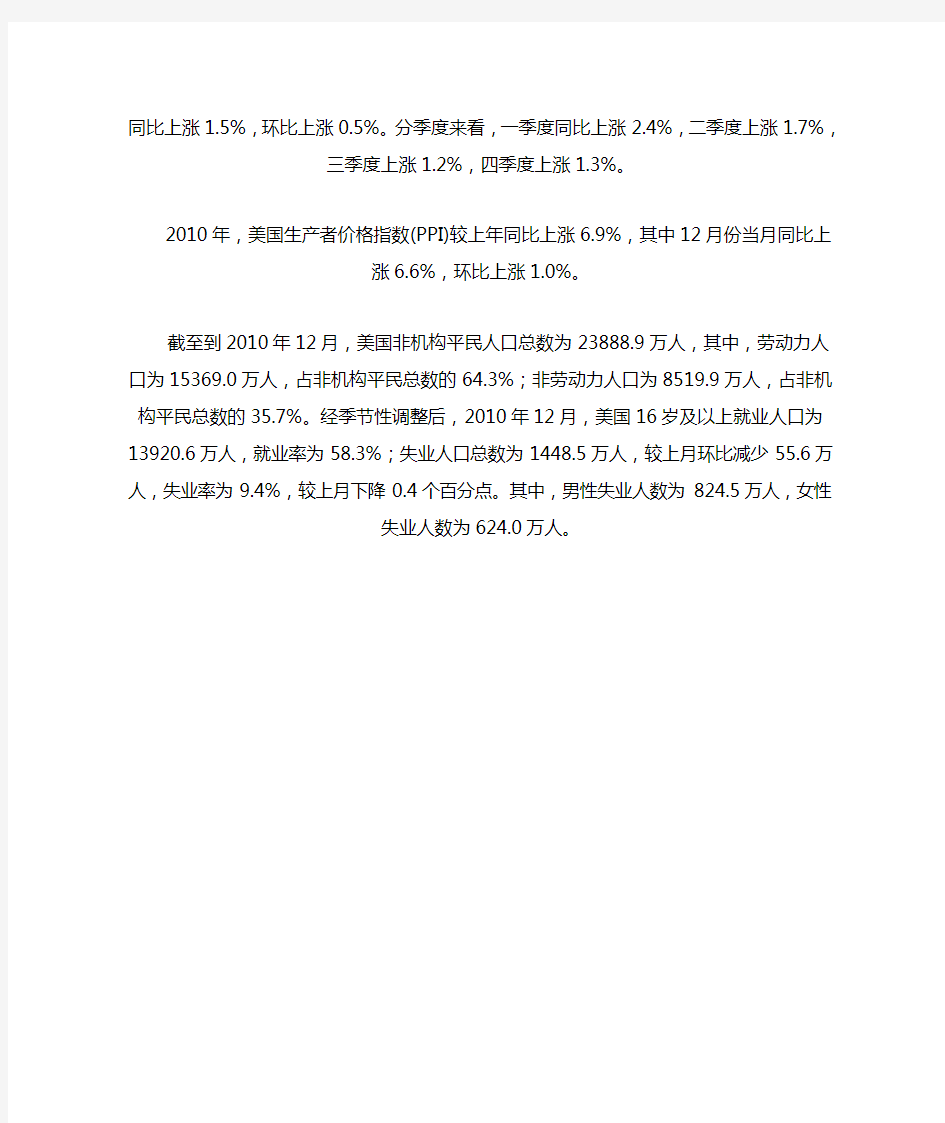
2010年,美国城市居民消费价格指数(CPI)较上年同比上涨1.6%,其中12月份当月同比上涨1.5%,环比上涨0.5%。分季度来看,一季度同比上涨2.4%,二季度上涨1.7%,三季度上涨
1.2%,四季度上涨1.3%。
2010年,美国生产者价格指数(PPI)较上年同比上涨6.9%,其中12月份当月同比上涨6.6%,
环比上涨1.0%。
截至到2010年12月,美国非机构平民人口总数为23888.9万人,其中,劳动力人口为15369.0万人,占非机构平民总数的64.3%;非劳动力人口为8519.9万人,占非机构平民总数的35.7%。经季节性调整后,2010年12月,美国16岁及以上就业人口为13920.6万人,就业率为58.3%;失业人口总数为1448.5万人,较上月环比减少55.6万人,失业率为9.4%,较上月下降0.4个百分点。其中,男性失业人数为824.5万人,女性失业人数为624.0万人。
美国历年失业率:
2010年前美国(GDP)统计数据
2010年美国现价国内生产总值(GDP)统计数据 美国经济2011-01-29 08:40:57 阅读547 评论0 字号:大中小订阅 当地时间2011年1月28日上午8点30分,美国商务部经济分析局发布了2010年美国国内生 产总值数据。 数据显示,经历金融危机后,2010年美国实际国内生产总值较上年增长2.9%。 初步估算,2010年以现行价格计算,美国名义国内生产总值(GDP)为146602亿美元,较上年净增5412亿美元,同比增长3.8%;按2005年可比价格计算,实际国内生产总值为132487 亿美元,同比增长2.9%。 分季度同比来看,经季节调整后,各季度名义增长率为:一季度增长2.8%,二季度增长3.9%,三季度增长4.5%,四季度增长4.2%。各季度实际增长率为:一季度增长2.4%,二季度增长 3.0%,三季度增长3.2%,四季度增长2.8%。 分季度环比来看,各季度名义增长率为:一季度增长1.2%,二季度增长0.9%,三季度增长1.1%,四季度增长0.8%。各季度实际增长率为:一季度增长0.9%,二季度增长0.4%,三季度增长 0.6%,四季度增长0.8%。 分季度环比折年率来看,各季度名义增长率为:一季度增长4.8%,二季度增长3.7%,三季度增长4.6%,四季度增长3.4%。各季度实际增长率为:一季度增长3.7%,二季度增长1.7%, 三季度增长2.6%,四季度增长3.2%。 2010年,美国城市居民消费价格指数(CPI)较上年同比上涨1.6%,其中12月份当月同比上涨1.5%,环比上涨0.5%。分季度来看,一季度同比上涨2.4%,二季度上涨1.7%,三季度上涨 1.2%,四季度上涨1.3%。 2010年,美国生产者价格指数(PPI)较上年同比上涨6.9%,其中12月份当月同比上涨6.6%, 环比上涨1.0%。 截至到2010年12月,美国非机构平民人口总数为23888.9万人,其中,劳动力人口为15369.0万人,占非机构平民总数的64.3%;非劳动力人口为8519.9万人,占非机构平民总数的35.7%。经季节性调整后,2010年12月,美国16岁及以上就业人口为13920.6万人,就业率为58.3%;失业人口总数为1448.5万人,较上月环比减少55.6万人,失业率为9.4%,较上月下降0.4个百分点。其中,男性失业人数为824.5万人,女性失业人数为624.0万人。
中国历年GDP增长情况
年份 中国历年GDP增长情况 产总值 (人民币亿元) 增长率 1978 3645.2 11.7% 1979 4062.6 7.6% 1980 4545.6 7.8% 1981 4891.6 5.2% 1982 5323.4 9.1% 1983 5962.7 10.9% 1984 7208.1 15.2% 1985 9016.0 13.5% 1986 10275.2 8.8% 1987 1205&6 11.6% 1988 15042.8 11.3% 1989 16992.3 4.1% 1990 18667.8 3.8% 1991 21781.5 9.2% 1992 26923.5 14.2% 1993 35333.9 13.5% 1994 48197.9 12.6% 1995 60793.7 10.5% 1996 71176.6 9.6% 1997 78973.0 8.8% 1998 84402.3 7.8% 1999 89677.1 7.1% 2000 99214.6 8.0% 2001 109655.2 7.5% 2002 120332.7 8.3% 2003 135822.8 9.5% 2004 159878.3 10.1% 2005 183084.8 10.4% 2006 209407.0 11.6% 2007 246619.0 11.9% 2008 300670.0 9.0% 2009 340903.0 8.6% 2010 401512.8 17.8% 2011 473104.0 17.8% 2012 519470.1 9.8% 2013 568845.2 9.5% 2014 636463.0 7.4% 2015 676708.4 6.9%
中美历年GDP对比
When you are old and grey and full of sleep,
And nodding by the fire, take down this book, And slowly read, and dream of the soft look Your eyes had once, and of their shadows deep; How many loved your moments of glad grace, And loved your beauty with love false or true, But one man loved the pilgrim soul in you, And loved the sorrows of your changing face; And bending down beside the glowing bars, Murmur, a little sadly, how love fled And paced upon the mountains overhead And hid his face amid a crowd of stars. The furthest distance in the world Is not between life and death But when I stand in front of you Yet you don't know that I love you. The furthest distance in the world Is not when I stand in front of you Yet you can't see my love But when undoubtedly knowing the love from both
1929年-2010年中国历年GDP和美国历年GDP、日本历年GDP比较
1929年-2010年中国历年GDP和美国历年GDP、日本历年GDP比较 2011年美国GDP(国内生产总值):CNY¥1001630.902344亿元 2011年汇率6.29:1美元,2011年GDP实际增长191.7% 2011 USA GDP USD$159241.8亿美元 2010年美国GDP(国内生产总值):CNY¥974743.7亿元 2010年汇率6.65:1美元,2010年GDP实际增长3.8% 2010 USA GDP USD$146578亿美元 2009年美国GDP(国内生产总值):CNY¥963342.7815亿元 2009年汇率6.823:1美元,2009年GDP实际增长-1.7% 2009 USA GDP USD$141190.5亿美元 2008年美国GDP(国内生产总值):CNY¥1048799.126391亿元 2008年汇率7.299:1美元,2008年GDP实际增长2.2% 2008 USA GDP USD$143690.8亿美元 2007年美国GDP(国内生产总值):CNY¥1098648.434亿元 2007年汇率7.813:1美元,2007年GDP实际增长4.9% 2007 USA GDP USD$140618亿美元 2006年美国GDP(国内生产总值):CNY¥1081427.615078亿元 2006年汇率8.071:1美元,2006年GDP实际增长7.9% 2006 USA GDP USD$133989.3亿美元 2005年美国GDP(国内生产总值):CNY¥1028168.94亿元 2005年汇率8.277:1美元,2005年GDP实际增长6.3% 2005 USA GDP USD$124220亿美元 2004年美国GDP(国内生产总值):CNY¥967250.22亿元 2004年汇率8.277:1美元,2004年GDP实际增长6.6% 2004 USA GDP USD$116860亿美元
美国经济历年增长率(至2011年底)
Gross Domestic Product Percent change from preceding period Annual Quarterly (Seasonally adjusted annual rates) GDP percent change based on current dollars GDP percent change based on chained 2005 dollars GDP percent change based on current dollars GDP percent change based on chained 2005 dollars 1930-12.0-8.61947q2 5.6-0.6 1931-16.1-6.51947q37.0-0.3 1932-23.2-13.11947q417.1 6.2 1933-3.9-1.31948q19.7 6.5 193417.010.91948q211.17.5 193511.18.91948q310.1 2.2 193614.313.11948q4 1.90.6 19379.7 5.11949q1-7.3-5.5 1938-6.3-3.41949q2-5.4-1.4 19397.08.11949q3 2.2 4.6 194010.08.81949q4-3.6-3.7 194125.017.11950q116.017.2 194227.718.51950q214.312.7 194322.716.41950q326.816.6 194410.78.11950q416.07.2 1945 1.5-1.11951q121.5 5.1 1946-0.4-10.91951q29.6 6.8 19479.8-0.91951q38.48.2 194810.3 4.41951q4 5.20.7 1949-0.7-0.51952q1 3.8 4.1 19509.98.71952q2 1.10.4 195115.57.71952q37.4 2.7 1952 5.6 3.81952q415.113.9 1953 5.9 4.61953q17.87.7 19540.3-0.61953q2 3.9 3.1 19559.07.21953q3-0.9-2.4 1956 5.5 2.01953q4-5.4-6.2 1957 5.4 2.01954q1-0.7-1.9 1958 1.3-0.91954q20.80.5 19598.47.21954q3 5.2 4.6 1960 3.9 2.51954q49.48.3 1961 3.5 2.31955q114.212.0 19627.5 6.11955q28.5 6.8 1963 5.5 4.41955q38.6 5.5 19647.4 5.81955q4 6.4 2.2 19658.4 6.41956q1 2.2-1.8 19669.5 6.51956q2 5.6 3.2 1967 5.7 2.51956q3 4.7-0.5 19689.3 4.81956q48.3 6.7 19698.2 3.11957q18.4 2.5 1970 5.50.21957q2 1.8-1.0 1/27/12
美国历年GDP数据统计2
D–2February 2006 National Data A. Selected NIPA Tables The selected set of NIPA tables presents the most recent estimates of gross domestic product (GDP) and its components that were released on January 27, 2006. These estimates include the “advance” estimates for the fourth quarter of 2005. The selected set presents quarterly estimates that are updated monthly. Annual estimates are presented in most of the tables. The GDP news release is available on BEA ’s Web site within minutes after the release. T o re-ceive an e-mail notification of the release, go to
- 美国经济历年增长率
- 中美历年GDP数据分析及建模预测(1980-2025)
- 中美历年GDP数据
- 美国历年GDP和人均GDP
- 美国历年GDP和增长率
- 美国历年gdp增长率
- 美国人均GDP收入1929——2010年
- 中美历年GDP对比
- 历年美国GDP数据
- 美国历年GDP数据统计
- 中国美国l历年GDP图表
- 美国历年GDP与人口变化统计表
- 美国历年GDP和人均GDP
- 历年美国GDP数据
- 1994-2018中美历年GDP数据比较
- 1949-2007中国历年的GDP增长率、GDP总量、人均GDP,人口普查、对美元汇率、韩国历年人均GDP
- 美国历年经济数据
- 中国历年GDP增长情况
- 美国历年GDP及增长率更新至2013年
- 历年美国中国GDP在世界占比
