Case_Study_WV2_LIDAR_Comparison


PhotoSat WorldView-2 Stereo Satellite DEM Comparison to a LiDAR DEM over the Garlock Fault in Southeast California.
Gerry Mitchell, Geophysicist, President PhotoSat
June 2010
In June 2010, a study was conducted to measure the elevation mapping accuracy and resolution of PhotoSat’s WorldView-2 stereo satellite digital elevation models (DEMs) compared to LiDAR DEMs. For this comparative study, DigitalGlobe, the owner of the WorldView-2 satellite, provided a WorldView-2 stereo satellite photo pair over a 180km2 area in Southeast California.
The area was mapped with a LiDAR survey in April 2008 by OpenTopography. The LiDAR DEM data is available on the OpenTopography website
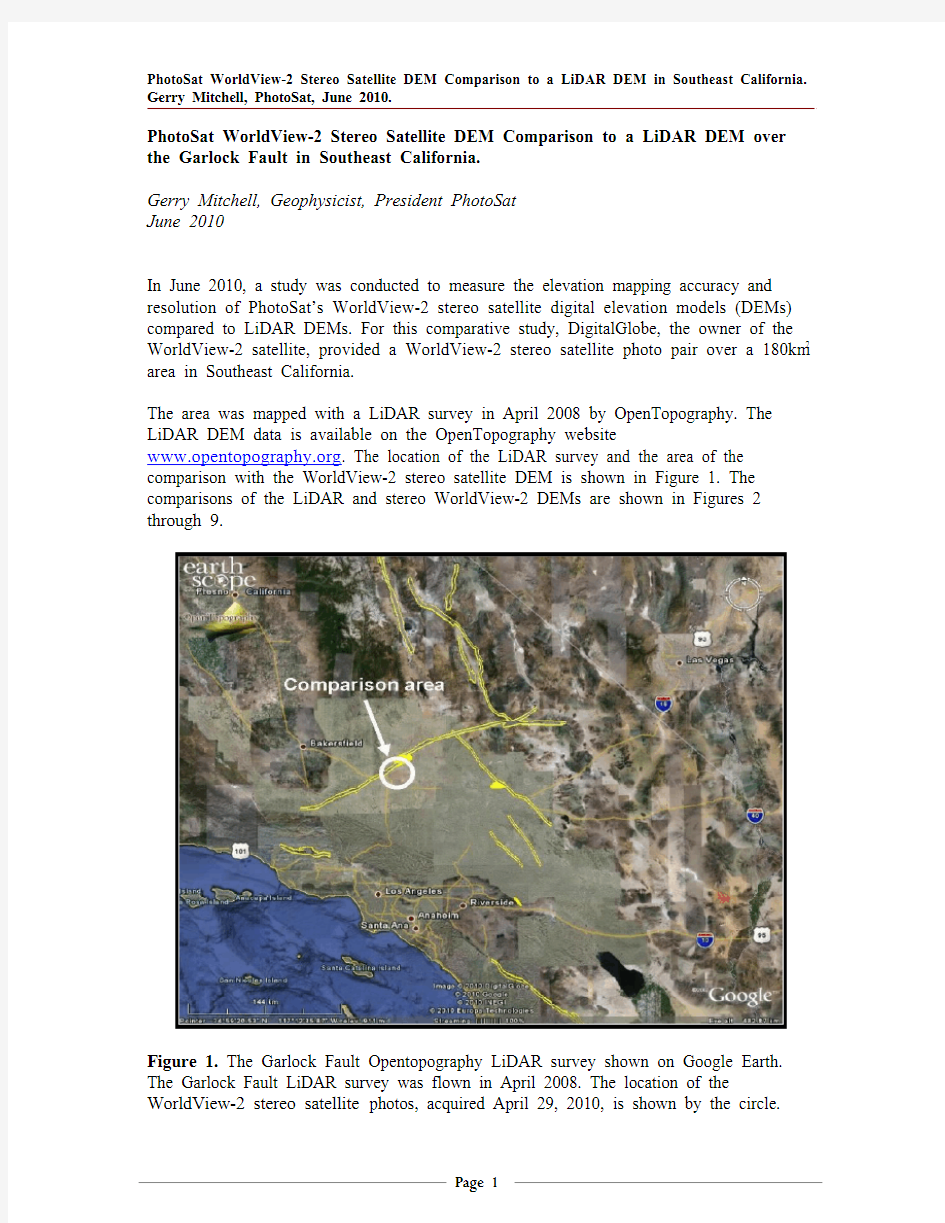
https://www.wendangku.net/doc/1a9318930.html,. The location of the LiDAR survey and the area of the comparison with the WorldView-2 stereo satellite DEM is shown in Figure 1. The comparisons of the LiDAR and stereo WorldView-2 DEMs are shown in Figures 2 through 9.
Figure 1. The Garlock Fault Opentopography LiDAR survey shown on Google Earth. The Garlock Fault LiDAR survey was flown in April 2008. The location of the WorldView-2 stereo satellite photos, acquired April 29, 2010, is shown by the circle.
Figure 2. An image showing a portion of the Opentopography LiDAR DEM. The dimensions of the area are 15 km east–west by 12 km north–south. Lower elevations are blue and higher elevations are red.
Figure 3. WorldView-2 50cm resolution orthophoto, created from the WorldView-2 stereo photos, for the area of the LiDAR survey used in this study. The 7.5 mile oval track is the Honda Proving Center of California.
Figure 4. Stereo WorldView-2 DEM image covering the area of the LiDAR image in Figure 2. This DEM has an elevation point every meter. At this scale, the LiDAR and WorldView-2 images are identical. Low elevations are blue and high elevations are red.
Figure 5. The elevation differences between the WorldView-2 and LiDAR DEMs are shown in a standard histogram on the left and a cumulative histogram on the right. If we assume that the LiDAR DEM is perfect, the WorldView-2 DEM elevations have a Root Mean Square Error (RMSE) of 33cm. Ninety percent of the stereo WorldView-2 elevations are within 35cm of the LiDAR elevations giving a 90% Linear Error (LE90) of 35cm.
Figure 6. Comparison of the LiDAR and WorldView-2 DEMs for a 2,500m wide area. Minor differences between the DEMs are visible at this scale.
Figure 7. Images of the LiDAR and WorldView-2 DEMs for a 500m wide area. At this scale, fine topographic features are much clearer on the LiDAR DEM.
Figure 8. Stereo WorldView-2 DEM image covering the area of the LiDAR image in areas with slopes less than 20% grade.
Figure 9. The elevation differences between the WorldView-2 and LiDAR DEMs for areas with slopes less than 20% grade are shown in a standard histogram on the left and a cumulative histogram on the right. The WorldView-2 DEM elevations have an RMSE of 19cm. Ninety percent of the stereo WorldView elevations are within 30cm of the LiDAR elevations giving a 90% Linear Error (LE90) of 30cm for this area.
Page 5
Figure 10. Stereo WorldView-2 DEM image covering the area of the LiDAR image in areas with slopes greater than 20% grade.
Figure 11. The elevation differences between the WorldView-2 and LiDAR DEMs for areas with slopes less than 20% grade are shown in a standard histogram on the left and a cumulative histogram on the right. The WorldView-2 DEM elevations have an RMSE of 77cm. Ninety percent of the stereo WorldView elevations are within 65cm of the LiDAR elevations giving a 90% Linear Error (LE90) of 65cm for this area.
Discussion:
PhotoSat is processing 50cm WorldView-1 and WorldView-2 stereo satellite photos to 1m Digital Elevation Models (DEMs) with vertical accuracies of better than 30cm RMSE, as determined by thousands of ground survey points on mapping projects in Eritrea and Mexico. For more information on these accuracy studies, please refer to the following reports:
http://www.photosat.ca/pdf/worldview2_satellite_elevation_mapping_poa_eritrea.pdf http://www.photosat.ca/pdf/WV_accuracy_chihuahua.pdf
Results summary:
To compare PhotoSat’s WorldView-2 DEMs to LiDAR DEMs, DigitalGlobe provided PhotoSat with stereo WorldView-2 photos over an area of southeast California with a publicly available LiDAR DEM by OpenTopography. The high quality OpenTopography LiDAR DEM has spectacular resolution and accuracy. When we make the assumption that the OpenTopography LiDAR DEM is perfectly accurate and use it to measure the accuracy of the WorldView-2 stereo DEM, we get the following elevation accuracy results for the 1m WorldView-2 DEM:
Entire 180 km2 area33cm RMSE35cm LE90
Areas with slopes < 20%19cm RMSE30cm LE90
Areas with slopes > 20%77cm RMSE65cm LE90 Advantages of Stereo Satellite DEMs:
Some advantages of stereo satellite DEMs are as follows:
?Large areas of stereo satellite photos can be acquired and processed quickly.
?Mapping projects may be anywhere in the world as the satellites have global coverage.
?No government survey permits are required, so there are no mapping project delays due to government bureaucracy.
?No charges for aircraft standby and crew waiting for favourable survey weather.
?No in-country presence is required.
References:
NCALM LiDAR. Southern California and Washington (Yakima) Fault Systems LiDAR Survey (April 2 – April 26, 2008) Processing Report.
https://www.wendangku.net/doc/1a9318930.html,/metadata/SOCAL_REPORT_final.pdf
