Now let’s de?ne a functon in R ,which we will call CV ,to compute the coef?cient of variation,
>CV <-function(x)sqrt(var(x))/mean(x)
So,let’s compute the CV
>CV(x)
[1]0.2524712
To generate a single bootstrap sample from this data vector,we use the command
>sample(x,replace=T)
which generates a bootstrap sample of the data vector x by sampling with replacement.Hence,to compute the CV using a single bootstrap sample,
>CV(sample(x,replace=T))[1]0.2242572
The particular value that R returns for you will be different as the sample is random.Some other useful commands:
>sum(x)returns the sum of the elements in x >mean(x)returns the mean of the elements in x
>var(x)returns the sample variance,i.e.,
i (x ?x )2/(n ?1)
>length(x)returns the number of items in x (i.e.,the sample size n )
Note that the sum command is fairly general,for example
>sum((x-mean(x))^2)computes
i (x ?x )2
So,lets now generate 1000bootstrap samples.We ?rst need to specify a vector of real values of lenght 1000,which we will call boot
>boot <-numeric(1000)
We now generate 1000samples,and assign the CV for bootstrap sample i as the i th element in the vector boot ,using a for loop
for (i in 1:1000)boot[i]<-CV(sample(x,replace=T))
The mean and variance of this collection of bootstrap samples are easily obtained using the mean and var commands (again,your values may differ),
>mean(boot)[1]0.2404653>var(boot)[1]0.00193073
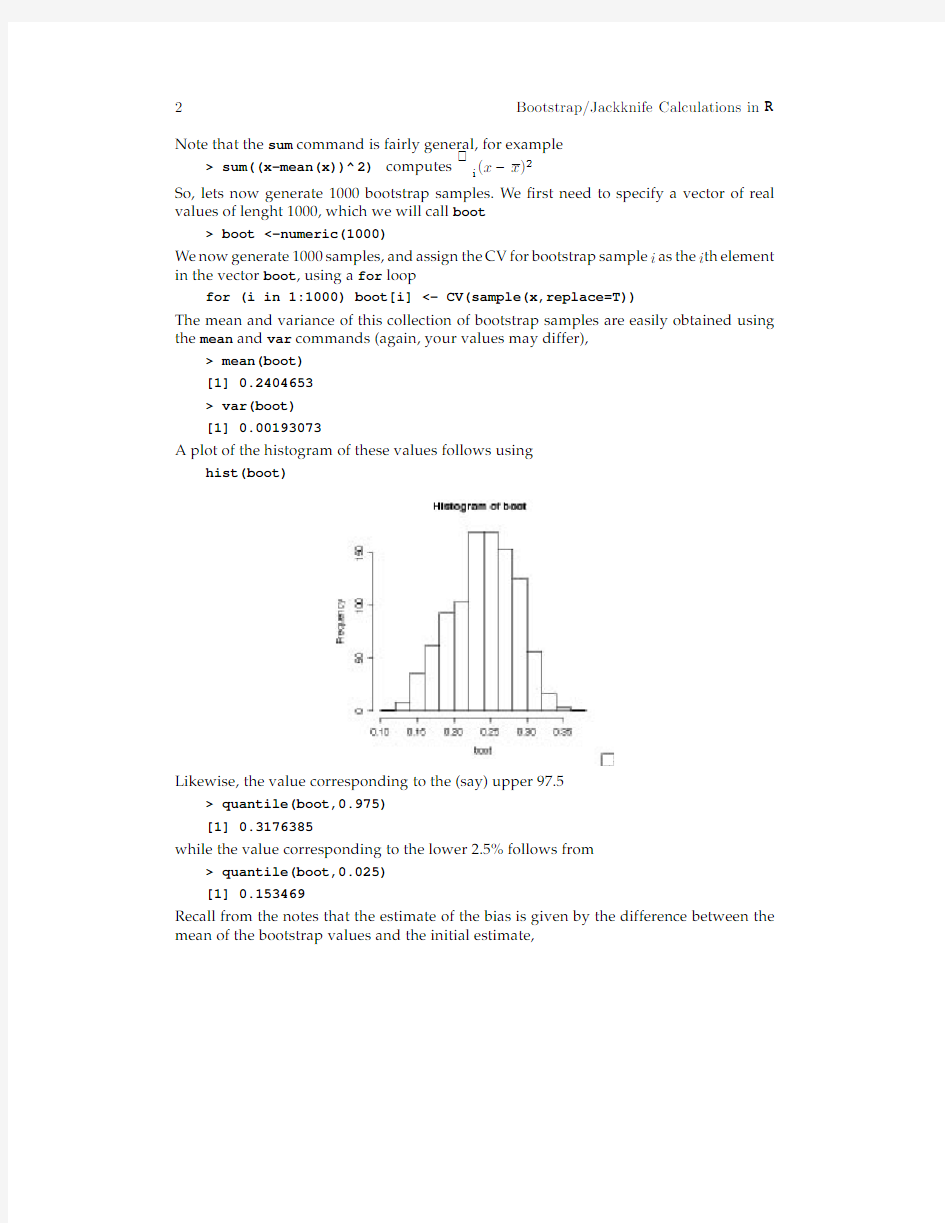
A plot of the histogram of these values follows using
hist(boot)
Likewise,the value corresponding to the (say)upper 97.5
>quantile(boot,0.975)[1]0.3176385
while the value corresponding to the lower 2.5%follows from
>quantile(boot,0.025)[1]0.153469
Recall from the notes that the estimate of the bias is given by the difference between the mean of the bootstrap values and the initial estimate,
>bias<-mean(boot)-CV(x)
and an bootstrap-corrected estimate of the CV is just the original estimate minus the bias, >CV(x)-bias
[1]0.2644771
Assuming normality,the approximate95%con?dence interval is given by
CV±1.96
(or adjusting for the bias an lower and upper values of
>CV(x)-bias- 1.96*sqrt(var(boot))
[1]0.1783546
>CV(x)-bias+ 1.96*sqrt(var(boot))
[1]0.3505997
Efron’s con?dent limit(Equation11on resampling notes)has an upper and lower value of
>quantile(boot,0.975)
[1]0.3176385
and
>quantile(boot,0.025)
[1]0.153469
While Hall’s con?dence limits(Equation12)has an upper and lower value of >2*CV(x)-quantile(boot,0.025)
[1]0.3514734
and
>2*CV(x)-quantile(boot,0.975)
[1]0.1873039
Jackknife Calculations
We now turn to jackkni?ng the sample.Recall from the randomization notes that this involves two steps.First,we generate a jackknife sample which has value x i removed and then compute the i th partial estimate of the test statistic using this sample,
θ
(x1···x i?1,x i,···x n)
i
We then turn this i th partial estimate into the i th pseudovalue θ?i using(Equation5c in random notes)
θ?
=n θ?(n?1) θi
i
where θis the estimate using the full data.
Let’s see how to code this in R using the previous vector x of data with our test statistic again being the coef?cient of variation(and hence our function CV previously de?ned). We?rst focus on generating the i th partial estimate and i th pseudovalue.We need to take the original data vector x and turn it into a vector(which we denote jack)of lenght n?1 as follows.First,we need to specify to R that we are creating the jackknife sample vector of the n?1sampled points
jack<-numeric(length(x)-1)
As before,we will use the command lenght(x)in place of n.We also need to specify to R that we will be generating a vector pseudo of the n pseudovalues
pseudo<-numeric(length(x))
Next,we need to?ll in the elements of the jack sample vector as follows.For ji,the j?1th element of jack is the j th element of x.We can state all this using a logical if..else statement within a for loop,
for(j in1:length(x))if(j
else if(j>i)jack[j-1]<-x[j]
We can then compute the i th pseudovalue(for the CV)as follows:
pseudo[i]<-lenght(x)*CV(x)-(lenght(x)-1)*CV(jack)
Finally,we top this all off by looping through the n possible i values,giving the?nal code as
J I A N G S U U N I V E R S I T Y 本科毕业论文 基于bootstrap的网页设计 Bootstrap-based web design 学院名称:计算机科学与通信工程学院 专业班级:软件(嵌入式)1102班 学生姓名:缪江超 指导教师姓名:马汉达 指导教师职称:高级工程师 2015年6月
基于bootstrap的网页设计 计算机科学与通信工程学院软件工程(嵌入式)缪江超 摘要::当今社会,网络是人们生活中不可或缺的一部分,网页则是传递信息的重要媒介。随着时代的进步,网页设计也随着网络技术的发展而不断发展。计算机学院实验中心信息管理系统,是2004年开发的,因设计开发时间较早,其界面已不适应当前的技术发展,不能满足师生对于网站美观要求。 Bootstrap是当下最受人们欢迎的前端框架,是基于HTML、CSS、JAVASCRIPT 的,它简洁灵活的特性使得 Web 开发更加快捷,Bootstrap提供了优雅的HTML和CSS规范,它由动态CSS语言Less写成。本文针对实验中心网站得主要问题,介绍了网页设计的相关理论,使用Bootstrap框架,对实验中心网站进行了重新布局设计,使得网站界面更为美观,用户体验更好。 关键字:前端开发 Bootstrap 布局架构实验室网站
Bootstrap-based web design Miao Jiangchao, Computer Science and Communication Engineering, Software Engineering (embedded) Professional Abstract: Nowadays, networks are an indispensable part of people's lives, the page is an important medium to transmit information. With the progress of the times,with the development of network technology,web design continue to develop. School of Computer Science Experiment Center Information Management System, developed in 2004, due to the design and development time earlier, the interface has not adapted to current technological developments, and can not meet the aesthetic requirements for teachers or students. Now Bootstrap is the most popular front frame,which is based on HTML, CSS, JAVASCRIPT, which is a clean and flexible features that make Web development faster. Bootstrap offers elegantly HTML and CSS specification, which is written by the dynamic CSS language Less. In this paper, the main problem is the Experimental Center site, introduces the theory of web design, use Bootstrap framework, the experimental center site re-layout design, making the site more attractive interface, better user experience. Key Words:Front-end development Bootstrap Layout Architecture Laboratory site
<meta name="viewport" content="width=device-width, initial-scale=1"> <!-- 上述3个meta标签*必须*放在最前面,任何其他内容都*必须*跟随其后!--> <title>Bootstrap 101 Template</title> <!-- Bootstrap --> <link href="css/bootstrap.min.css" rel="stylesheet"> <!-- HTML5 shim and Respond.js for IE8 support of HTML5 elements and media queries --> <!-- WARNING: Respond.js doesn't work if you view the page via file:// --> <!--[if lt IE 9]> <script src="//https://www.wendangku.net/doc/216908451.html,/html5shiv/3.7.2/html5shiv.min.js"& gt;</script> <script src="//https://www.wendangku.net/doc/216908451.html,/respond.js/1.4.2/respond.min.js"& gt;</script> <![endif]--> </head>
一、单选题(针对以下题目,请选择最符合题目要求的答案。针对每一道题目,所有答案都选对,则该题得分,所选答案错误或不能选出所有答案,则该题不得分。每题2.5分,共80分。) 1. Bootstrap 插件全部依赖是() A.JavaScript B.JQuery C.Angular JS D.Node JS 2. 栅格系统小屏幕使用的类前缀是() A. .col-xs- B. .col-sm- C. .col-md- D. .col-lg- 3. 如下代码中,想要在超小屏幕和小屏幕显示两列,在中屏幕和大屏幕显示三列,三个div的class正确的写法是()
item1
item2
item3
A. col-sm-6 col-md-4,col-sm-6 col-md-4,col-sm-6 col-md-4 B. col-sm-6 col-lg-4,col-sm-6 col-lg-4,col-sm-6 col-lg-4 C. col-xs-6 col-lg-4,col-xs-6 col-lg-4,col-xs-6 col-lg-4
D. col-xs-6 col-md-4,col-xs-6 col-md-4,col-xs-6 col-md-4 4. 下面可以实现列偏移的类是() A..col-md-offset-* B. .col-md-push-* C. .col-md-pull-* D. .col-md-move-* 5.表单元素要加上什么类,才能给表单添加圆角属性,和阴影效果() A.form-group B.form-horizontal C.form-inline D. form-control 6.img-responsive类可以让图片支持响应式布局,它的实现原理是() A.设置了max-width: 100%;和height: auto; B. 设置了max-width: 100%; 和height: 100%; C. 设置了width: auto; 和max-height: 100%; D. 设置了width: auto; 和height: auto; 7.输入框组想加上图标,可以实现对表单控件的扩展的类是() A. .input-group-btn B. .input-group-addon C. form-control D. input-group-extra 8. 标签页垂直方向堆叠排列,需要添加的类() A.nav-vertical B.nav-tabs C.nav-pills D.nav-stacked 9. 可以把导航固定在顶部的类是() A.navbar-fixed-top