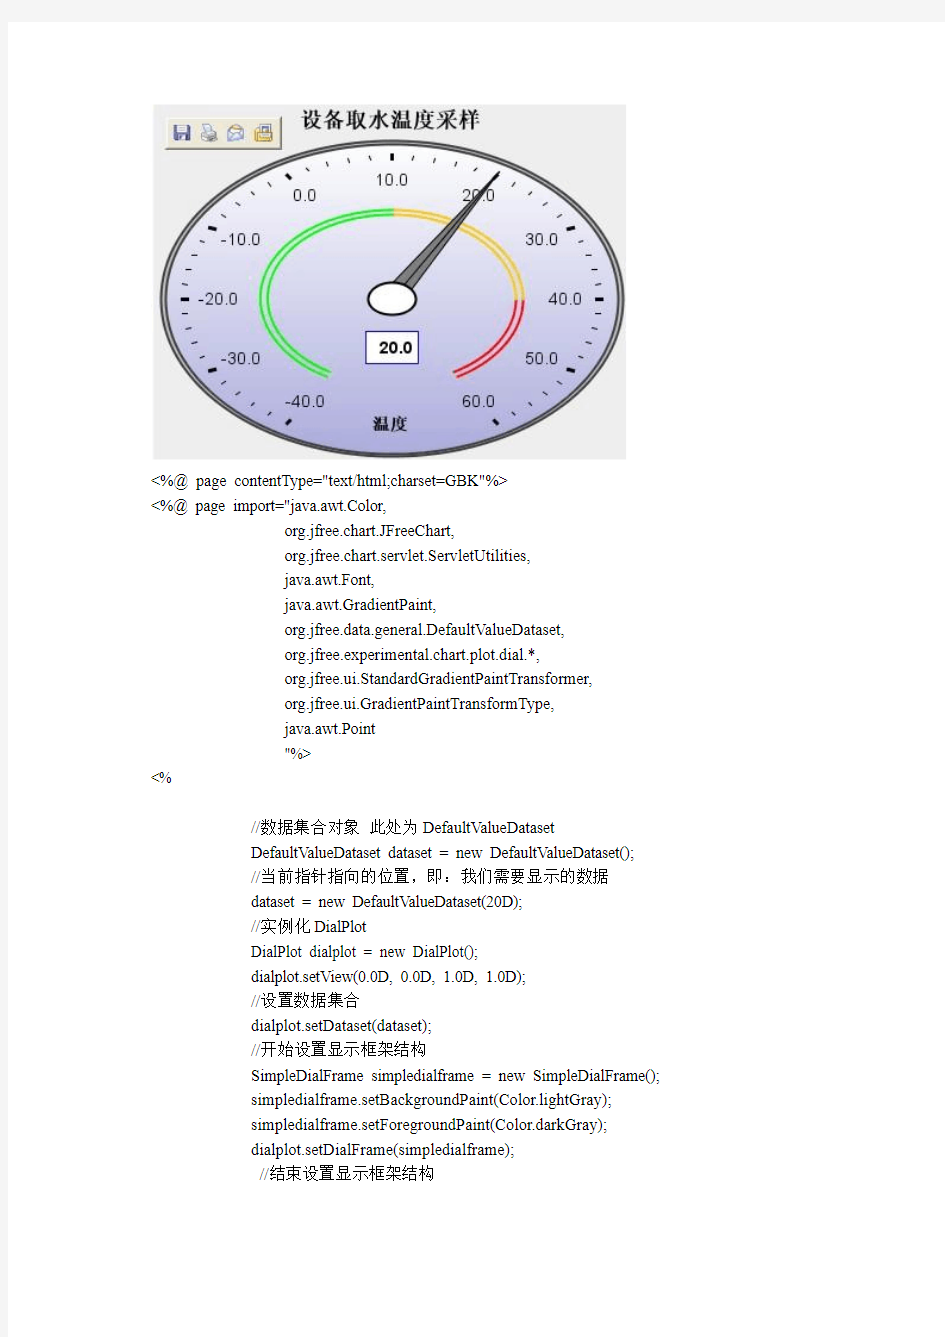
利用jfreechart制作动态仪表盘


<%@ page contentType="text/html;charset=GBK"%>
<%@ page import="java.awt.Color,
org.jfree.chart.JFreeChart,
org.jfree.chart.servlet.ServletUtilities,
java.awt.Font,
java.awt.GradientPaint,
org.jfree.data.general.DefaultValueDataset,
org.jfree.experimental.chart.plot.dial.*,
org.jfree.ui.StandardGradientPaintTransformer,
org.jfree.ui.GradientPaintTransformType,
java.awt.Point
"%>
<%
//数据集合对象此处为DefaultValueDataset
DefaultValueDataset dataset = new DefaultValueDataset();
//当前指针指向的位置,即:我们需要显示的数据
dataset = new DefaultValueDataset(20D);
//实例化DialPlot
DialPlot dialplot = new DialPlot();
dialplot.setView(0.0D, 0.0D, 1.0D, 1.0D);
//设置数据集合
dialplot.setDataset(dataset);
//开始设置显示框架结构
SimpleDialFrame simpledialframe = new SimpleDialFrame();
simpledialframe.setBackgroundPaint(Color.lightGray);
simpledialframe.setForegroundPaint(Color.darkGray);
dialplot.setDialFrame(simpledialframe);
//结束设置显示框架结构
GradientPaint gradientpaint = new GradientPaint(new Point(), new Color(255, 255, 255), new Point(), new Color(170, 170, 220));
DialBackground dialbackground = new DialBackground(gradientpaint);
dialbackground.setGradientPaintTransformer(new StandardGradientPaintTransformer(GradientPaintTransformType.VERTICAL));
dialplot.setBackground(dialbackground);
//设置显示在表盘中央位置的信息
DialTextAnnotation dialtextannotation = new DialTextAnnotation("温度");
dialtextannotation.setFont(new Font("Dialog", 1, 14));
dialtextannotation.setRadius(0.69999999999999996D);
dialplot.addLayer(dialtextannotation);
DialValueIndicator dialvalueindicator = new DialValueIndicator(0, "c");
dialplot.addLayer(dialvalueindicator);
//根据表盘的直径大小(0.88),设置总刻度范围
StandardDialScale standarddialscale = new StandardDialScale(-40D, 60D, -120D, -300D);
standarddialscale.setTickRadius(0.88D);
standarddialscale.setTickLabelOffset(0.14999999999999999D);
standarddialscale.setTickLabelFont(new Font("Dialog", 0, 14));
//主意是dialplot.addScale()不是dialplot.addLayer()
dialplot.addScale(0, standarddialscale);
//设置刻度范围(红色)
StandardDialRange standarddialrange = new StandardDialRange(40D, 60D, Color.red);
standarddialrange.setInnerRadius(0.52000000000000002D);
standarddialrange.setOuterRadius(0.55000000000000004D);
dialplot.addLayer(standarddialrange);
//设置刻度范围(橘黄色)
StandardDialRange standarddialrange1 = new StandardDialRange(10D, 40D, Color.orange);
standarddialrange1.setInnerRadius(0.52000000000000002D);
standarddialrange1.setOuterRadius(0.55000000000000004D);
dialplot.addLayer(standarddialrange1);
//设置刻度范围(绿色)
StandardDialRange standarddialrange2 = new StandardDialRange(-40D, 10D, Color.green);
standarddialrange2.setInnerRadius(0.52000000000000002D);
standarddialrange2.setOuterRadius(0.55000000000000004D);
dialplot.addLayer(standarddialrange2);
//设置指针
org.jfree.experimental.chart.plot.dial.DialPointer.Pointer pointer = new org.jfree.experimental.chart.plot.dial.DialPointer.Pointer();
dialplot.addLayer(pointer);
//实例化DialCap
DialCap dialcap = new DialCap();
dialcap.setRadius(0.10000000000000001D);
dialplot.setCap(dialcap);
//生成chart对象
JFreeChart jfreechart = new JFreeChart(dialplot);
//设置标题
jfreechart.setTitle("设备取水温度采样");
String filename = ServletUtilities.saveChartAsPNG(jfreechart, 400, 300, session);
//调用DisplayChart(配置在web.xml中),生成图形
String graphURL = request.getContextPath() + "/DisplayChart?filename=" + filename;
%>
|
