IEEE-RTS-24


The IEEE Reliability Test System
1System Description
The24bus system[1]is illustrated in Figure1.The slack bus of the system is node13.
Figure1:24-bus power system–IEEE One Area RTS-96
1.1Unit Data
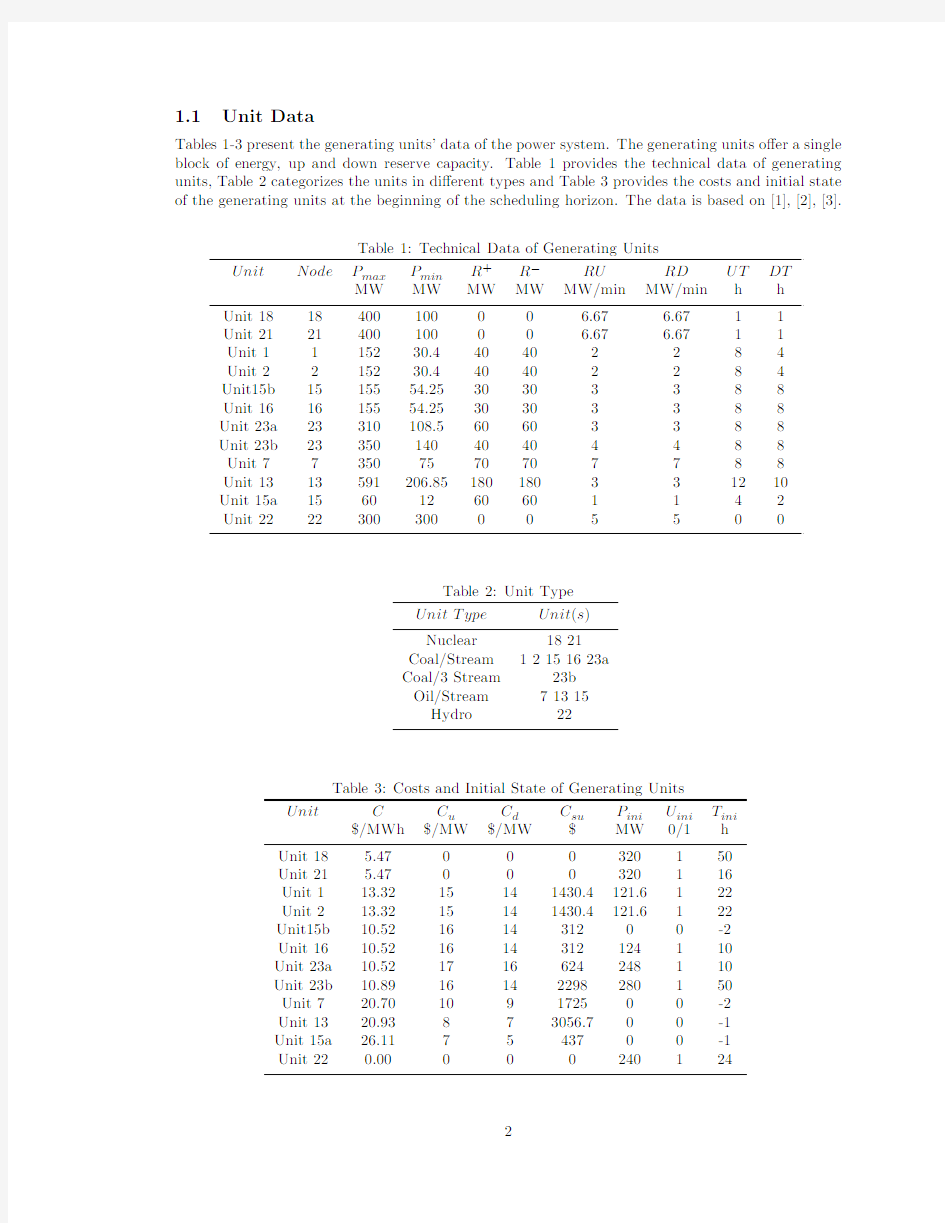
Tables1-3present the generating units’data of the power system.The generating units o?er a single block of energy,up and down reserve capacity.Table1provides the technical data of generating units,Table2categorizes the units in di?erent types and Table3provides the costs and initial state of the generating units at the beginning of the scheduling horizon.The data is based on[1],[2],[3].
Table1:Technical Data of Generating Units
Unit Node P max P min R+R?RU RD UT DT
MW MW MW MW MW/min MW/min h h Unit181840010000 6.67 6.6711
Unit212140010000 6.67 6.6711
Unit1115230.440402284
Unit2215230.440402284
Unit15b1515554.2530303388
Unit161615554.2530303388
Unit23a23310108.560603388
Unit23b2335014040404488
Unit773507570707788
Unit1313591206.85180180331210
Unit15a15601260601142
Unit2222300300005500
Table2:Unit Type
Unit T ype Unit(s)
Nuclear1821
Coal/Stream12151623a
Coal/3Stream23b
Oil/Stream71315
Hydro22
Table3:Costs and Initial State of Generating Units
Unit C C u C d C su P ini U ini T ini
$/MWh$/MW$/MW$MW0/1h
Unit18 5.47000320150
Unit21 5.47000320116
Unit113.3215141430.4121.6122
Unit213.3215141430.4121.6122
Unit15b10.52161431200-2
Unit1610.521614312124110
Unit23a10.521716624248110
Unit23b10.8916142298280150
Unit720.70109172500-2
Unit1320.93873056.700-1
Unit15a26.117543700-1
Unit220.00000240124
A positive T ini shows the time periods that the generating unit has been online at the beginning of scheduling horizon.A negative one shows the time periods that the generating unit has been o?ine at the beginning of scheduling horizon.
1.2Load Data
In Figure2,the load pro?le is illustrated.Table4provides the total system demand per hour and Table5presents the node location of the loads,as well as load at each node as a percentage of the total system demand.The load data is based on[2].
Figure2:System Demand Pro?le
Table4:Load Pro?le
Hour System Demand Hour System Demand
MW MW
11598.252132266.178
21502.834142266.178
31431.270152218.469
41407.416162218.469
51407.416172361.596
61431.270182385.450
71765.233192385.450
82051.487202290.032
92266.178212170.760
102290.032221979.924
112290.032231741.379
122266.178241502.834
Table5:Node Location and Distribution of the Total System Demand
Load Node%of system load Load Node%of system load
Load11 3.8Load1010 6.8
Load22 3.4Load13139.3
Load33 6.3Load1414 6.8
Load44 2.6Load151511.1
Load55 2.5Load1616 3.5
Load66 4.8Load181811.7
Load77 4.4Load1919 6.4
Load886Load2020 4.5
Load99 6.1
1.3Transmission Lines
The transmission lines data is given in Table6.The lines are characterized by the nodes that are connected,as well as the reactance and the capacity of each line.The data is based on[2].
Table6:Reactance and Capacity of Transmission Lines
F rom T o Reactance Capacity F rom T o Reactance Capacity
p.u.MVA p.u.MVA
120.014617511130.0488500
130.225317511140.0426500
150.090735012130.0488500
240.135617512230.0985500
260.20517513230.0884500
390.127117514160.0594500
3240.08440015160.0172500
490.11117515210.02491000
5100.0943*******.0529500
6100.064217516170.0263500
780.065235016190.0234500
890.176217517180.0143500
8100.176217517220.1069500
9110.08440018210.01321000
9120.08440019200.02031000
10110.08440020230.01121000
10120.08440021220.0692500
2Implementation Including Wind Power Production
It is recommended to include six wind farms at di?erent locations throughout the grid.It is proposed to locate the wind farms at3,5,7,16,21and23nodes.In this case,the capacity on the transmission lines connecting the node pairs(15,21),(14,16)and(13,23)is reduced to400MW,250MW and 250MW,respectively.This is done in order to introduce bottlenecks in the transmission system.
References
[1]C.Grigg,P.Wong,P.Albrecht,R.Allan,M.Bhavaraju,R.Billinton,Q.Chen,C.Fong,S.
Haddad,S.Kuruganty,et al.The IEEE Reliability Test System1996.A report prepared by the reliability test system task force of the application of probability methods subcommittee.IEEE Transactions on Power Systems,14(3):1010-1020,1999.
[2]A.J.Conejo,M.Carrion,J.M.Morales.Decision Making under Uncertainty in Electricity
Markets.Springer US,2010.
[3]F.Bou?ard,F.D.Galiana,A.J.Conejo.Market-Clearing with Stochastic Security Part II:
Case Studies.IEEE Transactions on Power Systems,20(4):1827-1835,2005. Nomenclature
C Production cost
C d Downward reserve cost
C su Start up cost
C u Upward reserve cost
DT Minimum down time of each generating unit
P ini Power output of each generating unit at time0
P max Maximum output power of each generating unit
P min Minimum output power of each generating unit
R+Maximum reserve capacity of up regulation of each generating unit
R?Minimum reserve capacity of up regulation of each generating unit
RD Ramp down rate of each generating unit
RU Ramp up rate of each generating unit
T ini Number of hours of which the generating unit was in/out at the beginning of planning horizon U ini Stating whether the unit is online/o?ine at time0
UT Minimum up time of each generating unit
