2015年湖北省统计年鉴第二章

57
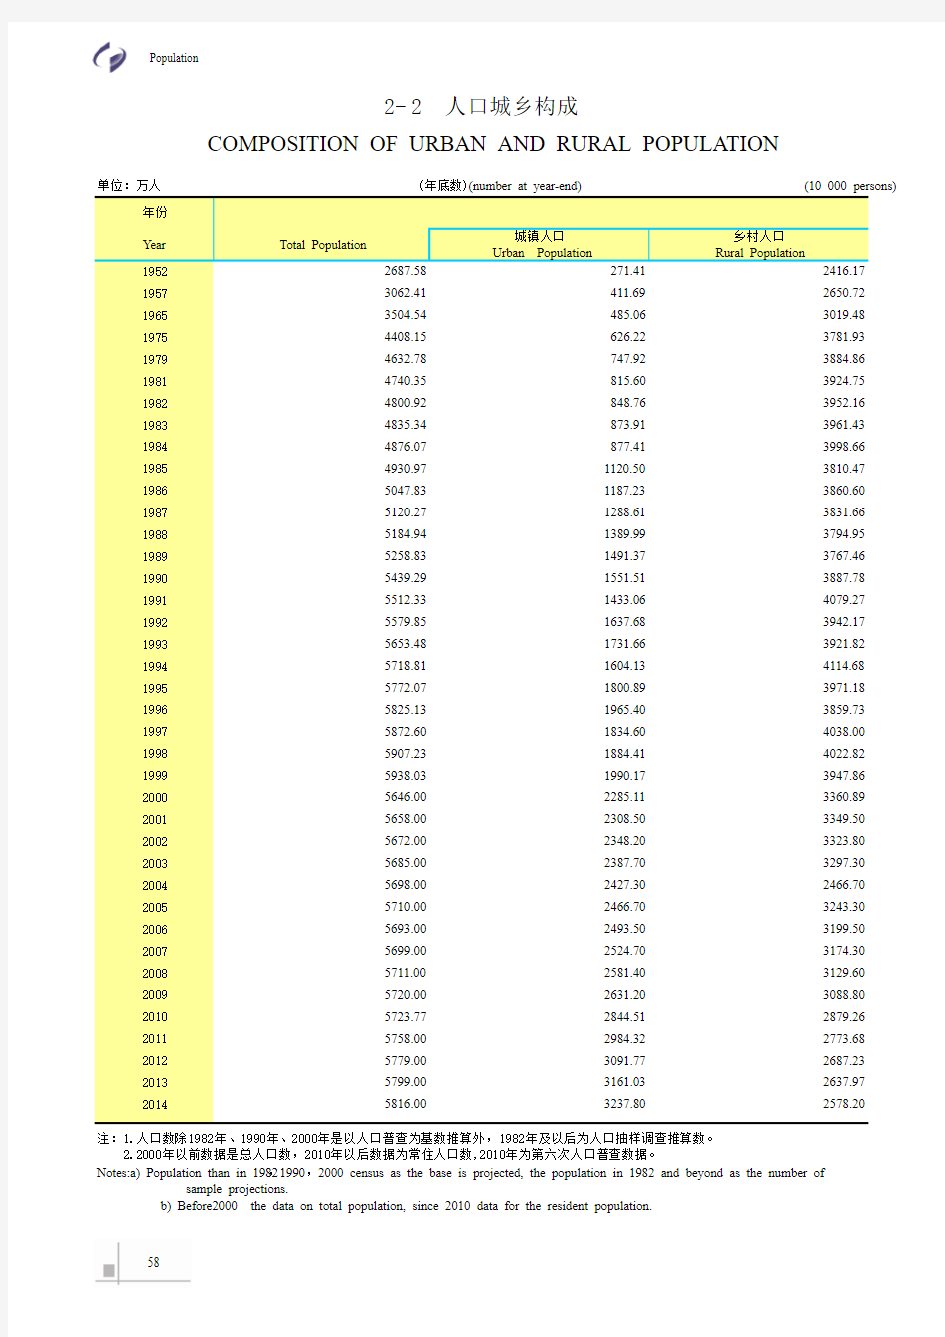
单位:万人
(10 000 persons)
年份 总人口
Year Total Population
男Male
女Female
19522745.01414.61330.419573062.41579.71482.719653504.51793.41711.219754408.22261.62146.519804684.52401.72282.719814740.32430.92309.419824800.92464.32336.619834835.32485.62349.819844876.12510.92365.219854931.02540.02391.019864989.02573.42415.619875058.12608.72449.419885144.22652.12492.119895223.92694.62529.319905373.52771.52602.019915446.82805.42641.419925513.62841.32672.419935590.52880.82709.619945656.82915.62741.219955727.12952.22775.019965776.32979.62796.819975838.83014.12824.819985890.63039.92850.719995942.53061.82880.720005936.03066.12869.920015956.63073.22883.420025978.23086.22892.020036000.53109.92890.620046001.33107.82893.520055984.13102.42881.720066038.33129.72908.720076084.93154.02930.920086110.83167.52943.320096141.93185.52956.420106176.03202.02974.020116164.13194.02970.120126165.43193.92971.420136170.63199.52971.12014
6162.3
3198.1
2964.2
Note: The total population of the total household population in 2010 census household population.
2-1 总 人 口
POPULATION
(年底数)(num ber at year-end)
注:总人口为户籍总人口,2010年为人口普查户籍人口数。
58
单位:万人
(10 000 persons)
年份Year Total Population
城镇人口Urban Population
乡村人口Rural Population
19522687.58271.412416.1719573062.41411.692650.7219653504.54485.063019.4819754408.15626.223781.9319794632.78747.923884.8619814740.35815.603924.7519824800.92848.763952.1619834835.34873.913961.4319844876.07877.413998.6619854930.971120.503810.4719865047.831187.233860.6019875120.271288.613831.6619885184.941389.993794.9519895258.831491.373767.4619905439.291551.513887.7819915512.331433.064079.2719925579.851637.683942.1719935653.481731.663921.8219945718.811604.134114.6819955772.071800.893971.1819965825.131965.403859.7319975872.601834.604038.0019985907.231884.414022.8219995938.031990.173947.8620005646.002285.113360.8920015658.002308.503349.5020025672.002348.203323.8020035685.002387.703297.3020045698.002427.302466.7020055710.002466.703243.3020065693.002493.503199.5020075699.002524.703174.3020085711.002581.403129.6020095720.002631.203088.8020105723.772844.512879.2620115758.002984.322773.6820125779.003091.772687.2320135799.003161.032637.972014
5816.00
3237.80
2578.20
注:1.人口数除1982年、1990年、2000年是以人口普查为基数推算外,1982年及以后为人口抽样调查推算数。 2.2000年以前数据是总人口数,2010年以后数据为常住人口数,2010年为第六次人口普查数据。
Notes:a) Population than in 1982,1990,2000 census as the base is projected, the population in 1982 and beyond as the number of sample projections.
b) Before2000 the data on total population, since 2010 data for the resident population.
2-2 人口城乡构成
COMPOSITION OF URBAN AND RURAL POPULATION
(年底数)(number at year-end)
59
年 份
出生数
死亡数自然增长数出生率死亡率自然增长率Year Number of Birth
Number of Death
Number of Nature Growth
Birth Rate
Death Rate
Natural Growth Rate
1965121.4834.7586.7335.1010.0425.06197590.8034.5256.2820.747.8812.86198094.8432.5962.2520.367.0013.361985
97.83
37.37
60.46
19.95
7.62
12.33
1986107.0939.4567.6421.017.7413.271987108.5636.1272.4421.437.1314.30198897.6232.9564.6719.08 6.4412.641989110.1336.2473.8921.09 6.9414.151990
114.40
38.66
75.74
21.60
7.30
14.30
1991113.3440.3073.0420.707.3613.341992105.6038.0867.5219.05 6.8712.181993112.5538.9273.6320.04 6.9313.111994103.3137.9865.3318.17 6.6811.491995
92.96
39.70
53.26
16.18
6.91
9.27
199693.2440.1853.0616.08 6.939.15199786.6239.1347.4914.81 6.698.12199874.0939.4634.6312.58 6.70 5.88199968.5237.7330.7911.57 6.37 5.202000
57.76
35.75
22.01
9.71
6.01
3.70
200150.8436.2714.578.51 6.07 2.44200250.1036.9013.208.38 6.17 2.21200349.5035.6013.908.26 5.94 2.32200450.6636.2314.438.43 6.03 2.402005
52.60
34.30
18.30
8.74
5.69
3.05
200654.8035.9018.909.08 5.95 3.13200755.6936.1219.579.19 5.96 3.23200855.9839.5116.479.21 6.50 2.71200957.8036.5821.229.48 6.00 3.482010
59.30
34.46
24.84
10.36
6.02
4.34
201159.6734.5225.1510.39 6.01 4.38201263.4535.3028.1511.00 6.12 4.88201364.1435.6028.5411.08 6.15 4.932014
68.88
40.42
28.46
11.86
6.96
4.90
注:1985年以后人口变动系数为人口抽样调查数,其余为公安年报数。
Note: The data of change of population after 1985 was based on census, the rest were from public security annual report.
2-3 全省人口自然变动
NATURAL CHANGE OF POLULATION
人口变动数(万人)
Number of Population Changed (10 000 persons)变动系数(‰)Growth Rates
60
单位:万人
(10 000 persons)户籍人口(万人)
常住人口(万人)户籍人口(万人)常住人口(万人)全 省 Province 6162.335816.00 丹江口市Danjiangkou 45.9944.27武汉市Wuhan 827.311033.80宜昌市Yichang 400.40410.45 江岸区Jiang'an 71.1193.70 西陵区
Xilin
43.5253.75 江汉区Jianghan 47.7971.90 伍家岗区Wujiagang 16.5022.60 硚口区Qiaokou 53.6385.63 点军区Dianjun 10.5010.48 汉阳区Hanyang 54.7162.40 猇亭区Huting 5.16 6.37 武昌区Wuchang 111.03125.51 夷陵区yiling 52.3352.29 青山区Qingshan 43.8551.70 远安县Yuan'an 19.4218.67 洪山区
Hongshan
79.34149.89 兴山县xingshan 17.1817.07 东西湖区Dongxihu 28.3150.82 秭归县Zigui 38.0136.13 汉南区Hannan 11.2912.90 长阳县Changyang 40.2538.60 蔡甸区Caidian 48.4367.60 五峰县Wufeng 20.4618.77 江夏区Jiangxia 69.8184.65 宜都市Yidu 39.6838.90 黄陂区Huangpi 112.1691.10 当阳市Dangyang 48.3546.77 新洲区Xinzhou 95.8586.00 枝江市Zhijiang 49.0250.05黄石市
Huangshi
265.14244.92襄阳市Xiangyang 595.45560.02 黄石港区Huangshigang 20.3223.72 襄城区Xiangcheng 46.4448.99 西塞山区Xisai mountainous 21.4624.66 樊城区Fancheng 78.4788.90 下陆区Xialu 15.3218.24 襄州区Xiangzhou 102.5891.39 铁山区Tieshan 5.54 5.83 南漳县 Nanzhang 58.9153.92 大冶市Daye 95.9090.13 谷城县Gucheng 59.6752.21 阳新县Yangxin
106.6082.34 保康县
Baokang
27.1925.17十堰市346.97
337.27 老河口市Laohekou 52.8348.47茅箭区Maojian 28.5641.59 枣阳市Zaoyang 112.6198.95张湾区Zhangwan 26.2638.18 宜城市Yicheng 56.7552.02郧阳区Yunyang 63.1256.31鄂州市
Ezhou
110.18105.88郧西县Yunxi 51.7145.11 梁子湖区Liangzihu 18.6414.42竹山县Zhushan 46.4841.29 华容区Huarong 26.2323.98竹溪县Zhuxi 36.9831.08 鄂城区Ercheng
65.31
67.48
房 县
Fang
47.88
39.44
注:以上数据为第六次人口普查数推算数,常住人口是指常住本地半年以上人口。Note:The permanent resident population is more than half the local population.
Region
Population of Permnant Residents
2-4 全省市、州、县年底人口数(2014) POPULATION OF CITIES, TOWNS, AND COUNTIES OF HUBEI AT YEAR-END(2014)
Population of Permnant Residents
Total Population
地 区
Total Population
地 区
Region
61
单位:万人
(10 000 persons)
户籍人口
常住人口户籍人口常住人口Total Permnant Total Permnant Population
Population
Population
Population
荆门市Jingmen 300.29288.91 蕲春县Hanchun 101.8377.36东宝区Dongbao 37.2437.13 黄梅县Huangmei 105.0486.37掇刀区Zhuodao 33.2230.14 麻城市Macheng 115.5087.54 京山县Jingshan 64.5762.71 武穴市Wuxue 80.5265.14 沙洋县Shayang 59.2557.41咸宁市Xianning 296.46248.92 钟祥市Zhongxiang 106.01101.52 咸安区Xian'an 60.9451.95孝感市Xiaogan 525.72486.13 嘉鱼县Jiayu 36.7031.67 孝南区Xiaonan 96.9491.77 通城县Tongcheng 51.1740.72 孝昌县Xiaochang 66.7959.45 崇阳县Congyang 49.1439.80 大悟县Dawu 63.4761.9 通山县Tongshan 45.9536.38 云梦县Yunmeng 57.4152.84 赤壁市Chibi 52.5748.40 应城市Yingcheng 66.9059.81随州市Suizhou 257.11218.38 安陆市Anlu 62.3257.72 曾都区Zengdu 64.9162.67 汉川市Hanchuan 111.90102.64 随县 Sui 97.3579.34荆州市Jingzhou 658.45574.42 广水市Guangshui 94.8576.37 沙市区Shashi 54.7665.08恩施州Enshi Prefecture 406.29331.77 荆州区Jingzhou 56.5157.27 恩施市Enshi 82.0976.58 公安县Gong'an 104.2089.99 利川市Jianli 91.7165.95 监利县Jianli 158.39107.93 建始县Jianshi 51.5241.54 江陵县Jianglin 40.7333.25 巴东县Badong 49.8642.44 石首市Shishou 65.8057.64 宣恩县Xuan'en 36.3730.19 洪湖市Honghu 93.4685.90 咸丰县Xianfeng 39.2330.42 松滋市Songzi 84.5877.36 来凤县Laifeng 33.1624.50黄冈市Huanggang 741.43626.25 鹤峰县Hefeng 22.3520.15 黄州区Huangzhou 35.1037.22省直管单位Jurisdictional 431.13348.88 团风县Tuanfeng 37.3134.06 仙桃市Xiantao 154.99116.60 红安县Hong'an 64.7260.19 潜江市Qianjiang 103.9795.44 罗田县Luotian 59.4754.69 天门市Tianmen 164.24129.16 英山县Yingshan 40.2035.92神农架林区Shennongjian
7.92
7.67
浠水县
Xishui
101.73
87.76
2-4 续表 C ont i nued
地 区
Regions
地 区
Regions
62
主主要要统统计计指指标标解解释释
人口数 指一定时点、一定地区范围内有生命的个人总和。 年度统计的年末人口数指每年12月31日24时的人口数。
城镇人口和乡村人口 城镇人口是指居住在城镇范围内的全部常住人口;乡村人口是除上述人口以外的全部人口。 出生率(又称粗出生率) 指在一定时期内(通常为一年)一定地区的出生人数与同期内平均人数(或期中人数)之比,用千分率表示。本资料中的出生率指年出生率,其计算公式为:
年出生人数
出生率= ×1000‰
年平均人数
式中:出生人数指活产婴儿,即胎儿脱离母体时(不管怀孕月数),有过呼吸或其他生命现象。年平均人数指年初、年底人口数的平均数,也可用年中人口数代替。
死亡率(又称粗死亡率) 指在一定时期内(通常为一年)一定地区的死亡人数与同期内平均人数(或期中人数)之比,用千分率表示。本资料中的死亡率指年死亡率,其计算公式为:
年死亡人数
死亡率= ×1000‰
年平均人数
人口自然增长率 指在一定时期内(通常为一年)人口自然增加数(出生人数减死亡人数)与该时期内平均人数(或期中人数)之比,用千分率表示。计算公式为:
本年出生人数-本年死亡人数
人口自然增长率= ×1000‰
年平均人数
=人口出生率-人口死亡率
Explanatory Notes on Main Statistical Indicators
Total Population refers to the total number of people alive at a certain point of time within a given area. The annual statistics on total population is taken at midnight, the 3lst of December.
Urban Population and Rural Population Urban population refer to all people residing in cities and towns, while rural population refer to population other than urban population.
Birth Rate (or Crude Birth Rate) refers to the ratio of the number of births to the average population (or mid-period population) during a certain period of time (usually a year), expressed in ‰. Birth rate in the chapter refers to annual birth rate. The following formula is used:
Birth Rate = (Number of Birth s/Average Number of Population)×1000‰
Number of births in the formula refers to live births, i.e. when a baby has breathed or showed any vital phenomena regardless of the length of pregnancy.
Annual average number of population is the average of the number of population at the beginning of the year and that at the end of the year. Sometimes it is substituted by the mid-year population.
Death Rate (or Crude Death Rate)refers to the ratio of the number of deaths to the average population (or mid-period population) during a certain period of time (usually a year), expressed in ‰. Death rate in the chapter refers to annual deat h rate. The following formula is used:
Death Rate= (Number of Deaths/Annual Average Number of Population)×1000‰
Natural Growth Rate of Population refers to the ratio of natural increase in population (number of births minus number of deaths) in a certain period of time (usually a year) to the average population (or mid-period population) of the same period, expressed in ‰. The following formula is applied:
Natural Growth Rate of Population = [(Number of Births-Number of Deaths)/Average Number of Population]×1000‰
Natural Growth Rate of Population = Birth Rate-Death Rate
63
湖北省各州市人口数据统计
2017年湖北省各州市人口数据统计据中商产业研究院大数据库显示,2016年末湖北省常住人口5885万人,比上年增加33.5万人。其中,城镇人口数量为3419.19万人,占总人口的58.1%,乡村人口2465.81万人,占2016年常住人口总数的41.9%。乡村与城镇人口占总人口差距为16.2%,同2015年差距13.7%有所扩大。相对2015年城镇人口占总人口的56.9%,2016年城镇化水平不断提高。从2010-2016年湖北省常住人口变动情况来看,整体上湖北省人口处于平缓增长状态. 数据来源:湖北省统计局、中商产业研究院整理 分地区来看,湖北省各省市常住人口数量最多的前三个地区是武汉市、黄冈市以及荆州市,2016年末常住人口分别为1076.62万人、632.10万人、569.79万人。襄阳市和孝感市人口紧随其后,2016年底襄阳市常住人口数量为563.9万人,户籍人口为594.25万人。孝感市常住人口490.43万人,户籍人口数量523.21万人。 数据来源:湖北省统计局、中商产业研究院整理 受国家二胎政策的大力支持,2016年湖北省人口出生人数有明显的上升趋势。2016年出生人数达70.65万人,为近六年间首次超过70万人,比上年增加了12.77%。死亡人数40.9万人,比上一年提高20.26%。整体看来,2010-2016年湖北省自然增长数保持着稳步增长的态势。 数据来源:湖北省统计局、中商产业研究院整理 中商产业研究院简介 中商产业研究院是深圳中商情大数据股份有限公司下辖的研究机构,研究范围涵盖智能装备制造、新能源、
新材料、新金融、新消费、大健康、“互联网+”等新兴领域。公司致力于为国内外企业、上市公司、投融资机构、会计师事务所、律师事务所等提供各类数据服务、研究报告及高价值的咨询服务。 中商行业研究服务内容 行业研究是中商开展一切咨询业务的基石,我们通过对特定行业长期跟踪监测,分析行业需求、供给、经营特性、盈利能力、产业链和商业模式等多方面的内容,整合行业、市场、企业、用户等多层面数据和信息资源,为客户提供深度的行业市场研究报告,全面客观的剖析当前行业发展的总体市场容量、竞争格局、进出口情况和市场需求特征等,对行业重点企业进行产销运营分析,并根据各行业的发展轨迹及实践经验,对各产业未来的发展趋势做出准确分析与预测。中商行业研究报告是企业了解各行业当前最新发展动向、把握市场机会、做出正确投资和明确企业发展方向不可多得的精品资料。 中商行业研究方法 中商拥有10多年的行业研究经验,利用中商Askci数据库立了多种数据分析模型,在产业研究咨询领域利用行业生命周期理论、SCP分析模型、PEST分析模型、波特五力竞争分析模型、SWOT分析模型、波士顿矩阵、国际竞争力钻石模型等、形成了自身独特的研究方法和产业评估体系。在市场预测分析方面,模型涵盖对新产品需求预测、快速消费品销售预测、市场份额预测等多种指标,实现针对性的进行市场预测分析。 中商研究报告数据及资料来源 中商利用多种一手及二手资料来源核实所收集的数据或资料。一手资料来源于中商对行业内重点企业访谈获取的一手信息数据;中商通过行业访谈、电话访问等调研获取一手数据时,调研人员会将多名受访者的资料及意见、多种来源的数据或资料进行比对核查,公司内部也会预先探讨该数据源的合法性,以确保数据的可靠性及合法合规。二手资料主要包括国家统计局、国家发改委、商务部、工信部、农业部、中国海关、
2016年统计年鉴14-8分地区建筑业总产值(2015年).doc
14-8分地区建筑业总产值(2015 年) 单位:万元 地区建筑业总产值 建筑工程产值安装工程产值其他 全国1807574736 1602679019 149917943 54977774 北京84367296 79920630 3690172 756494 天津44889031 38357837 4742226 1788968 河北52525685 43632917 5310420 3582348 山西29312627 25359465 3003554 949608 内蒙古11234710 9389935 1043927 800847 辽宁54137623 44179785 7691905 2265932 吉林22163142 18631469 2480740 1050934 黑龙江16803928 13189109 3127692 487127 上海56524682 47623605 7782729 1118349 江苏247858134 232782387 13215009 1860737 浙江239805916 217388715 17222310 5194891 安徽56959353 48827159 4354850 3777345 福建76058135 70111588 5053633 892913 江西46024920 39671083 3313600 3040237 山东93817165 79806928 11933047 2077190 河南80476477 70280138 7228680 2967660 湖北105928564 93635752 8896266 3396546
2016年统计年鉴11-22按国别(地区)分对外经济合作(2015年).doc
11-22按国别(地区)分对外经济合作(2015年) 承包工程劳务合作 国别 ( 地区) 完成营业额派出人数年末在外人数派出人数 ( 万美元) ( 人) ( 人) ( 人) 合计15407423 253070 408565 276800 亚洲6907010 133373 168038 215426 阿富汗1133 90 49 巴林27 3 孟加拉国175184 2402 3335 115 文莱8653 150 202 缅甸189471 4131 4548 485 柬埔寨121396 3033 5573 1513 塞浦路斯113 319 朝鲜1832 311 721 中国香港402744 225 783 39918 印度267458 926 1491 161 印度尼西亚481528 8062 12940 178 伊朗159048 1393 2030 227 伊拉克397661 7294 10421 93 以色列15238 105 114 日本44346 521 42252 约旦8459 49 57 1 科威特128114 2968 2728 78 老挝321606 11815 10247 459 黎巴嫩721 中国澳门147710 479 1581 72779 马来西亚356227 9756 9351 3752
务合作 年末在外人数 ( 人) 618295 487077 9 119 787 2311 324 52371 149 835 227 163 231 154353 1040 2285 1534 120414 5267
马尔代夫14380 163 252 蒙古93484 5363 3875 201 尼泊尔25302 1150 711 209 阿曼44939 44 467 23 巴基斯坦516289 6292 9038 36 巴勒斯坦527 16 菲律宾204150 1427 1474 234 卡塔尔136173 1553 2807 281 沙特阿拉伯701812 23836 27334 1581 新加坡354079 3298 5659 35014 韩国27393 146 87 2921 斯里兰卡136871 1582 3432 1480 叙利亚1634 5 泰国281007 2257 2787 290 土耳其133887 4596 6709 38 阿联酋153943 1628 5485 1250 也门共和国3354 69 162 7 越南352317 4933 8521 584 中国台湾3945 5 16 7386 东帝汶5315 244 332 哈萨克斯坦234700 13588 11129 1110 吉尔吉斯斯坦54857 1947 3505 192 塔吉克斯坦64377 1670 1633 18 土库曼斯坦68921 1013 990 乌兹别克斯坦61241 1352 2904 127 亚洲其他国家3444 2112 2043 非洲5478376 97555 194848 25754 阿尔及利亚824061 35363 59888 10841 安哥拉495275 11268 31030 4941
2015年湖北省统计年鉴第二章
57 单位:万人 (10 000 persons) 年份 总人口 Year Total Population 男Male 女Female 19522745.01414.61330.419573062.41579.71482.719653504.51793.41711.219754408.22261.62146.519804684.52401.72282.719814740.32430.92309.419824800.92464.32336.619834835.32485.62349.819844876.12510.92365.219854931.02540.02391.019864989.02573.42415.619875058.12608.72449.419885144.22652.12492.119895223.92694.62529.319905373.52771.52602.019915446.82805.42641.419925513.62841.32672.419935590.52880.82709.619945656.82915.62741.219955727.12952.22775.019965776.32979.62796.819975838.83014.12824.819985890.63039.92850.719995942.53061.82880.720005936.03066.12869.920015956.63073.22883.420025978.23086.22892.020036000.53109.92890.620046001.33107.82893.520055984.13102.42881.720066038.33129.72908.720076084.93154.02930.920086110.83167.52943.320096141.93185.52956.420106176.03202.02974.020116164.13194.02970.120126165.43193.92971.420136170.63199.52971.12014 6162.3 3198.1 2964.2 Note: The total population of the total household population in 2010 census household population. 2-1 总 人 口 POPULATION (年底数)(num ber at year-end) 注:总人口为户籍总人口,2010年为人口普查户籍人口数。
2015年贵州统计年鉴
2015年《贵州省统计年鉴》第二十九部分:29-29 卫 生 来源:贵州省统计局作者:时间:2015-12-03 浏览 1304次 29-29 卫生 Health Care
1991690836305916853978877743797816 1992473416245776752405879273853715 1993390816235772051888844093806015 1994393016605964853766880534035815 1995393416926029554475870054026015 19961093218705820554051842734354815 1997895518705756053627843484323614 1998911318775784454492844004413814 1999970318745862455138856134547314 2000899218785838055148853974567314 2001879118725912055876861034641214 2002702718575985057742797273696415 2003649918665928156273775573691114 2004666418506131358113766993691114 2005657118436178458398778053552116 2006614718556645262586823244114717 2007590719397580671400852984210020 2008584819348313278129893133883023 2009573619829752791164952704017127 201056372005105277974901025274215830 2011568320711175341080291122104403727 20122737922101365421296701526084920032 20132918224291633321558481565575587738 20142899525121817281740021697995780242
成都统计年鉴2015(区市县)
15-1区(市)县土地面积、户籍总户数和总人口数(2014年) Land Area, Registered Households and Population in Districts, 293
15-2历年区(市) 县 Total Registered Population in Districts, Cities at County Level 294
年末户籍人口数 and Counties over the Years (Year–end) 1550 4768 5938 2642 3096 1316 1703 3173 4378 4003 4220 1678 5212 5716 2815 3467 1496 1874 3509 4968 4528 4475 1485 4966 4498 2461 2809 1346 1618 3177 4664 3771 4032 1656 5412 5043 2737 3163 1521 1800 3650 5172 4089 4318 1990 6287 5800 3245 3718 1848 2111 4234 6024 4832 5055 2256 7163 7308 3704 4289 2177 2432 4666 6603 5592 5537 2331 7424 7443 3803 4366 2238 2488 4761 6753 5752 5634 2350 7470 7552 3840 4375 2248 2500 4798 6781 5764 5662 2370 7487 7617 3869 4391 2259 2524 4817 6817 5781 5705 2398 7540 7751 3916 4437 2287 2556 4868 6884 5827 5752 2441 7593 7837 3943 4480 2308 2576 4919 6950 5852 5796 2458 7609 7863 3955 4494 2313 2584 4949 6968 5879 5823 2467 7605 7899 3959 4497 2323 2591 4989 6977 5895 5847 2499 7652 7952 3992 4515 2354 2612 5044 7026 5914 5888 2498 7711 8071 3995 4562 2389 2639 5109 7120 5962 5942 2520 7790 8190 4034 4616 2412 2668 5191 7218 6019 6003 2555 7868 8301 4070 4652 2430 2691 5271 7271 6067 6067 2591 7951 8451 4110 4694 2437 2711 5326 7322 6110 6141 2650 8053 8494 4212 4737 2454 2728 5429 7381 6188 6221 2685 8108 8554 4245 4762 2463 2743 5492 7427 6223 6264 2755 8142 8618 4271 4794 2472 2766 5545 7469 6273 6294 2848 8173 8693 4312 4813 2478 2784 5602 7517 6298 6335 2897 8189 8730 4355 4837 2492 2797 5682 7559 6330 6381 2933 8226 8790 4412 4861 2522 2819 5728 7592 6362 6413 2977 8263 8401 4475 4883 2533 2838 5773 7607 6382 6448 3008 8295 8457 4557 4910 2537 2851 5804 7619 6402 6458 3039 8331 8518 4627 4924 2545 2865 5849 7652 6410 6468 3052 8373 8543 4662 4931 2550 2882 5874 7691 6409 6467 3056 8446 8616 4709 4961 2563 2895 5944 7740 6398 6462 3066 8438 8667 4758 4961 2563 2900 5946 7726 6386 6451 3087 8448 8698 4804 4966 2564 2907 5955 7722 6361 6444 3137 8448 8846 4833 4968 2559 2920 5971 7782 6354 6493 3194 8455 9064 4883 4990 2566 2938 5984 7774 6353 6508 3293 8536 9269 4696 5061 2575 2966 6025 7788 6447 6633 3384 8619 9281 4843 5137 2610 2993 6104 7837 6514 6687 3439 8650 9389 4947 5149 2605 3019 6090 7947 6506 6656 3535 8764 9485 5017 5167 2620 3048 6118 7996 6561 6702 36498833966150455175263030636096803466006741 3699 8845 9200 5086 5180 2630 3078 6096 8002 6582 6692 3776 8890 9421 5135 5186 2637 3087 6118 8053 6605 6718 3833 8904 9600 5187 5120 2635 3080 6138 8035 6561 6658 3904 8918 9781 5262 5127 2649 3100 6157 8062 6568 6680 4039 8938 10097 5425 5122 2664 3117 6193 8085 6572 6699 295
- 2019湖北省统计局年鉴-人口城乡构成
- 湖北省统计年鉴(2013)
- 湖北统计年鉴2017社会经济发展指标:交通运输业基本情况
- 湖北统计年鉴2017社会经济发展指标:总人口
- 湖北统计年鉴2018社会经济发展指标:货运量
- 湖北统计年鉴2017社会经济发展指标:职工平均工资及指数
- 湖北统计年鉴2016社会经济发展指标:各级各类学校毕业生数
- 湖北统计年鉴2015社会经济发展指标:市州行政区划
- 湖北省统计年鉴2014(1_9_地区生产总值)
- 湖北统计年鉴2018社会经济发展指标:限额以上住宿和餐饮业经营情况(2017)
- 湖北统计年鉴2018社会经济发展指标:按控股情况分固定资产投资(不含农户)(2017)续
- 2019湖北省统计局年鉴-分市、州、县年底人口数(2017)
- 湖北省各州市人口数据统计
- 湖北统计年鉴2018社会经济发展指标:城镇居民家庭平均每百户年末耐用品拥有量(2016)
- 湖北统计年鉴2018社会经济发展指标:按国民经济行业分的基本建设投资续
- 湖北统计年鉴2017社会经济发展指标:湖北旅游主要指标
- 2019湖北省统计局年鉴-主要城市土地面积、人口情况(2017)
- 湖北统计年鉴2018社会经济发展指标:湖北国内旅游接待人数及收入
- 2011湖北省统计年鉴
- 湖北统计年鉴2014(2)