f5_2009_dec_ans

Fundamentals Level – Skills Module, Paper F5
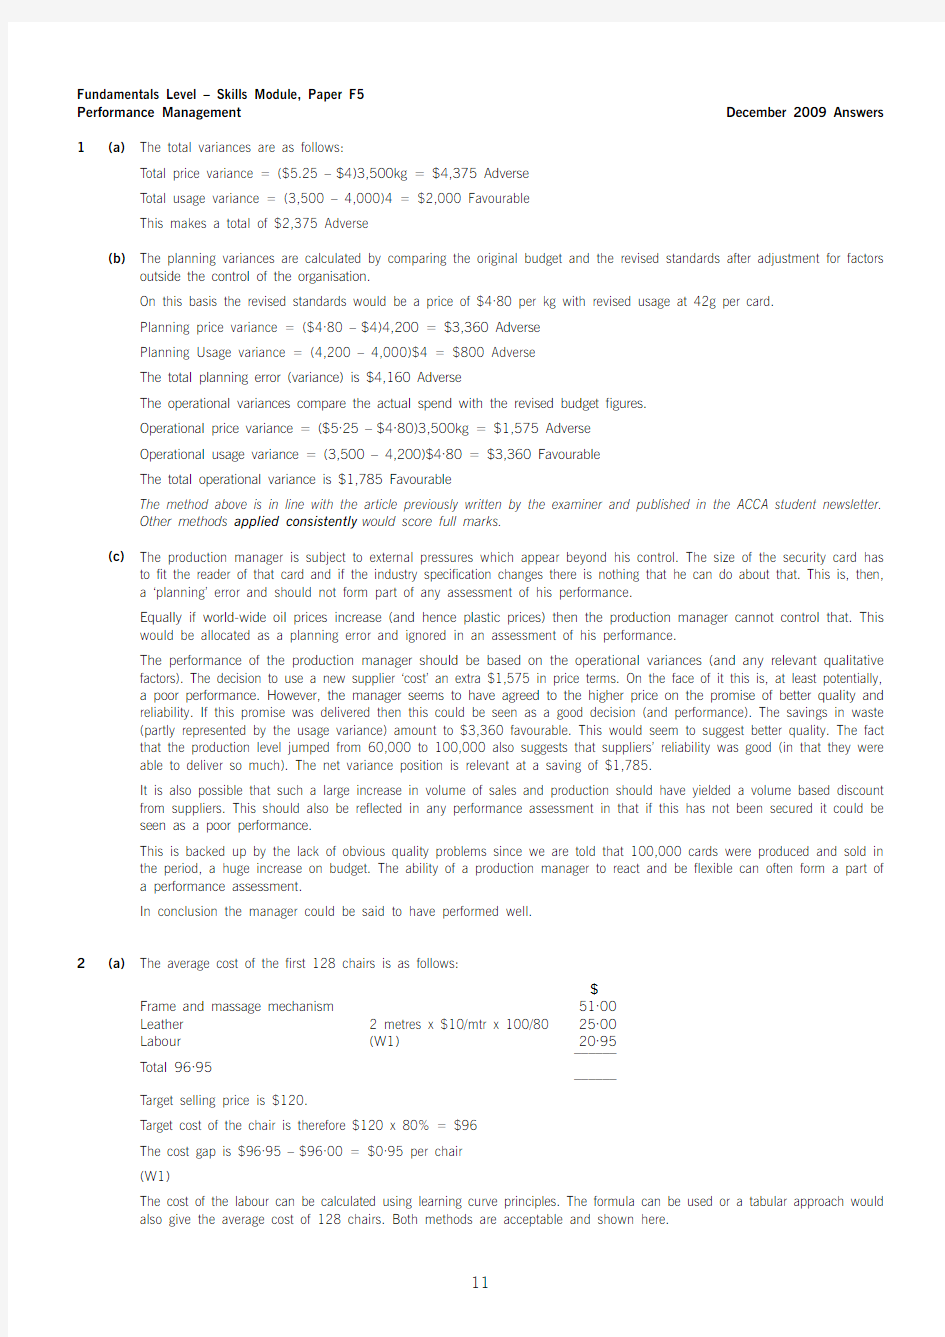
Performance Management December 2009 Answers 1(a)The total variances are as follows:
T otal price variance = ($5.25 –$4)3,500kg = $4,375 Adverse
T otal usage variance = (3,500 – 4,000)4 = $2,000 Favourable
This makes a total of $2,375 Adverse
(b)The planning variances are calculated by comparing the original budget and the revised standards after adjustment for factors
outside the control of the organisation.
On this basis the revised standards would be a price of $4·80 per kg with revised usage at 42g per card.
Planning price variance = ($4·80 –$4)4,200 = $3,360 Adverse
Planning Usage variance = (4,200 – 4,000)$4 = $800 Adverse
The total planning error (variance) is $4,160 Adverse
The operational variances compare the actual spend with the revised budget figures.
Operational price variance = ($5·25 –$4·80)3,500kg = $1,575 Adverse
Operational usage variance = (3,500 – 4,200)$4·80 = $3,360 Favourable
The total operational variance is $1,785 Favourable
The method above is in line with the article previously written by the examiner and published in the ACCA student newsletter.
Other methods applied consistently would score full marks.
(c)The production manager is subject to external pressures which appear beyond his control. The size of the security card has
to fit the reader of that card and if the industry specification changes there is nothing that he can do about that. This is, then,
a ‘planning’ error and should not form part of any assessment of his performance.
Equally if world-wide oil prices increase (and hence plastic prices) then the production manager cannot control that. This would be allocated as a planning error and ignored in an assessment of his performance.
The performance of the production manager should be based on the operational variances (and any relevant qualitative factors). The decision to use a new supplier ‘cost’ an extra $1,575 in price terms. On the face of it this is, at least potentially,
a poor performance. However, the manager seems to have agreed to the higher price on the promise of better quality and
reliability. If this promise was delivered then this could be seen as a good decision (and performance). The savings in waste (partly represented by the usage variance) amount to $3,360 favourable. This would seem to suggest better quality. The fact that the production level jumped from 60,000 to 100,000 also suggests that suppliers’ reliability was good (in that they were able to deliver so much). The net variance position is relevant at a saving of $1,785.
It is also possible that such a large increase in volume of sales and production should have yielded a volume based discount from suppliers. This should also be reflected in any performance assessment in that if this has not been secured it could be seen as a poor performance.
This is backed up by the lack of obvious quality problems since we are told that 100,000 cards were produced and sold in the period, a huge increase on budget. The ability of a production manager to react and be flexible can often form a part of
a performance assessment.
In conclusion the manager could be said to have performed well.
2(a)The average cost of the first 128 chairs is as follows:
$
Frame and massage mechanism51·00
Leather 2 metres x $10/mtr x 100/8025·00
Labour(W1)20·95
––––––
T otal 96·95
––––––
T arget selling price is $120.
T arget cost of the chair is therefore $120 x 80% = $96
The cost gap is $96·95 –$96·00 = $0·95 per chair
(W1)
The cost of the labour can be calculated using learning curve principles. The formula can be used or a tabular approach would also give the average cost of 128 chairs. Both methods are acceptable and shown here.
T abulation:
Cumulative output Average time per Total time (hrs)Average cost per
(units)unit (hrs)chair at $15 per hour
12
21·9
41·805
81·71475
161·6290125
321·54756188
641·47018378
1281·39667459178·7720·95
Formula:
Y = ax b
Y = 2 x 128–0·074000581
Y = 1·396674592
The average cost per chair is 1·396674592 x $15 = $20·95
(b)T o reduce the cost gap various methods are possible (only four are needed for full marks)
–Re-design the chair to remove unnecessary features and hence cost
–Negotiate with the frame supplier for a better cost. This may be easier as the volume of sales improve as suppliers often are willing to give discounts for bulk buying. Alternatively a different frame supplier could be found that offers a better
price. Care would be needed here to maintain the required quality
–Leather can be bought from different suppliers or at a better price also. Reducing the level of waste would save on cost.
Even a small reduction in waste rates would remove much of the cost gap that exists
–Improve the rate of learning by better training and supervision
–Employ cheaper labour by reducing the skill level expected. Care would also be needed here not to sacrifice quality or push up waste rates.
(c)The cost of the 128th chair will be:
$
Frame and massage mechanism51·00
Leather 2 metres x $10/mtr x 100/8025·00
Labour1·29 hours x $15 per hour (W2)19·35
––––––
T otal 95·35
––––––
Against a target cost of $96 the production manager is correct in his assertion that the required return is now being achieved.
(W2)
Using the formula, we need to calculate the cost of the first 127 chairs and deduct that cost from the cost of the first 128 chairs.
Y = ax b
Y = 2 x 127–0·074000581
Y = 1·39748546
T otal time is 127 x 1·39748546 = 177·48 hours
Time for the 128th chair is 178·77 – 177·48 = 1·29 hours
3(a)In 2010 the four quarters will be numbers 5–8, consequently the trend figures for waste to be collected will be: Quarter 1 (Q = 5): 2,000 + 25(5) = 2,125 tonnes
Quarter 2 (Q = 6): 2,000 + 25(6) = 2,150 tonnes
Quarter 3 (Q = 7): 2,000 + 25(7) = 2,175 tonnes
Quarter 4 (Q = 8): 2,000 + 25(8) = 2,200 tonnes
Seasonal adjustments are needed thus:
Quarter 1: 2,125 – 200 = 1,925
Quarter 2: 2,150 + 250 = 2,400
Quarter 3: 2,175 + 150 = 2,325
Quarter 4: 2,200 – 100 = 2,100
T otal tonnage is 1,925 + 2,400 + 2,325 + 2,100 = 8,750 tonnes for the year.
(b)Regression analysis can be used to calculate the variable operating and fixed operating costs in 2009.
Tonnes (X)Total Cost (Y)XY X2
$000’s
2,1009501,995,0004,410,000
2,50010102,525,0006,250,000
2,40010102,424,0005,760,000
2,3009902,277,0005,290,000
Sum9,3003,9609,221,00021,710,000
Y = a +bX
Where ‘a’ is fixed operating cost and ‘b’ is variable operating cost in this context.
Using the formula given:
b = (4 x 9,221,000 – 9,300 x 3,960)/(4 x 21,710,000 –(9,300)2)
b = 0·16 or $160 per tonne as the original data is in $000’s. This was the variable operating cost per tonne for 2009.
a = (3,960/4) – (0·16 x 9,300/4)
a = 618 or $618,000 as the original data is in $000’s. This was the fixed operating cost in 2009.
Allowing for inflation:
The variable operating cost in 2010 will be $160 x 1·05 = $168 per tonne
The fixed operating cost in 2010 will be $618,000 x 1·05 = $648,900
(c)Advantages of an incremental budgeting approach:
–Local government organisations are often complex and incremental budgeting will be seen as a simple approach to a budget that will take little effort.
–Budget processes can be long ones, however incremental approaches do tend to be quicker than most. Complex local government organisations can suffer from very long budget processes and incremental budgeting can alleviate this a
little.
Disadvantages of incremental budgeting:
–Public bodies, such as local governments, will be encouraged to use up all of this year’s budget in order to ensure that next year’s budget will be as high as possible to give themselves the flexibility they need to do whatever is needed. The
public services required can be unpredictable and so local government organisations prefer to be able to be flexible.
–Overspends made in this year will be budgeted for again next year, this is hardly giving taxpayers value for money.
4(a)TIPs Financial performance can be assessed in a number of ways:
Sales growth
Sales are up about 1·3% (W1) which is a little above the rate of inflation and therefore a move in the right direction. However, with average admission prices jumping about 8·6% (W2) and numbers of visitors falling there are clearly problems. Large increases in admission prices reduce the value proposition for the customer, it is unlikely that the rate of increase is sustainable or even justifiable. Indeed with volumes falling (down by 6·7%, (W6)) it appears that some customers are being put off and price could be one of the reasons.
Maintenance and repairs
There appears to be a continuing drift away from routine maintenance with management preferring to repair equipment as required. This does not appear to be saving any money as the combined cost of maintenance and repair is higher in 2009 than in 2008 (possible risks are dealt with in part (b)).
Directors pay
Absolute salary levels are up 6·7% (W3), well above the modest inflation rate. It appears that the shareholders are happy with the financial performance of the business and are prepared to reward the directors accordingly. Bonus levels are also well up. It may be that the directors have some form of profit related pay scheme and are being rewarded for the improved profit performance. The directors are likely to be very pleased with the increases to pay.
Wages
Wages are down by 12% (W5). This may partly reflect the loss of customers (down by 6·7% (W6) if we assume that at least part of the wages cost is variable. It could also be that the directors are reducing staff levels beyond the fall in the level of customers to enhance short-term profit and personal bonus. Customer service and indeed safety could be compromised here.
Net profit
Net profit is up a huge 31·3% (W7) and most shareholders would be pleased with that. Net profit is a very traditional measure of performance and most would say this was a sign of good performance.
Return on assets
The profitability can be measured relative to the asset base that is being used to generate it. This is sometimes referred to as ROI or return on investment. The return on assets is up considerably to 11·4% from 8% (W8). This is partly due to the significant rise in profit and partly due to the fall in asset value. We are told that TIP has cut back on new development so the fall in asset value is probably due to depreciation being charged with little being spent during the year on assets. In this regard it is inevitable that return on assets is up but it is more questionable whether this is a good performance. A theme park (and thrill rides in particular) must be updated to keep customers coming back. The directors on TIP are risking the future of the park.
(b)Quality provision
Reliability of the rides
The hours lost has increased significantly. Equally the % of capacity lost due to breakdowns is now approaching 17·8% (W9).
This would appear to be a very high number of hours lost. This would surely increase the risk that customers are disappointed being unable to ride. Given the fixed admission price system this is bound to irritate some customers as they have effectively paid to ride already.
Average queuing time
Queuing will be seen by customers as dead time. They may see some waiting as inevitable and hence acceptable. However TIP should be careful to maintain waiting times at a minimum. An increase of 10 minutes (or 50%) is likely to be noticeable by customers and is unlikely to enhance the quality of the TIP experience for them. The increase in waiting times is probably due to the high number of hours lost due to breakdown with customers being forced to queue for a fewer number of ride options.
Safety
The clear reduction in maintenance could easily damage the safety record of the park and is an obvious quality issue.
Risks
If TIP continues with current policies then they will expose themselves to the following risks:
–The lack of routine maintenance could easily lead to an accident or injury to a customer. This could lead to compensation being paid or reputational damage
–Increased competition. The continuous raising of admission prices increases the likelihood of a new competitor entering the market (although there are significant barriers to entry in this market e.g. capital cost, land and so on).
–Loss of customers. The value for money that customers see when coming to TIP is clearly reducing (higher prices, less reliability of rides and longer queues). Regardless of the existence of competition customers could simply chose not to come, substituting another leisure activity instead
–Profit fall. In the end if customers’ numbers fall then so will profit. The shareholders, although well rewarded at the moment could suffer a loss of dividend. Directors’ job security could then be threatened
Workings:
(W1)Sales growth is $5,320,000/$5,250,000 = 1·01333 or 1·3%
(W2)Average admission prices were:
2008: $5,250,000/150,000 = $35 per person
2009: $5,320,000/140,000 = $38 per person
An increase of $38/$35 = 1·0857 or 8·57%
(W3)Directors pay up by $160,000/$150,000 = 1·0667 or 6·7%
(W4)Directors bonuses levels up from $15,000/$150,000 or 10% to $18,000/$160,000 or 12·5% of turnover. This is an increase of 3/15 or 20%
(W5)Wages are down by (1 – $2,200,000/$2,500,000) or 12%
(W6)Loss of customers is (1 – 140,000/150,000) or 6·7%
(W7)Profits up by $1,372,000/$1,045,000 = 1·3129 or 31·3%
(W8)Return on assets:
2008: $1,045,000/$13,000,000 = 1·0803 or 8·03%
2009: $1,372,000/$12,000,000 = 1·114 or 11·4%
(W9)Capacity of rides in hours is 360 days x 50 rides x 10 hours per day = 180,000
2008 lost capacity is 9,000/180,000 = 0·05 or 5%
2009 lost capacity is 32,000/180,000 = 0·177 or 17·8%
5(a)The relevant costs of the decision to cease the manufacture of the TD are needed:
Cost or Revenue Working reference Amount ($)
Lost revenue Note 1(96,000)
Saved labour cost Note 248,000
Lost contribution from other products Note 3(118,500)
Redundancy and recruitment costs Note 4(3,700)
Supplier payments saved Note 588,500
Sublet income12,000
Supervisor Note 60
––––––––
Net cash flow(69,700)
––––––––
Conclusion: It is not worthwhile ceasing to produce the TD now.
Note 1:All sales of the TD will be lost for the next 12 months, this will lose revenue of 1,200 units x $80 = $96,000
Note 2:All normal labour costs will be saved at 1,200 units x $40 = $48,000
Note 3:Related product sales will be lost.
This will cost the business 5% x ((5,000u x $150) + (6,000u x $270)) = $118,500 in contribution (material costs
are dealt with separately below)
Note 4:If TD is ceased now, then:
Redundancy cost($6,000)
Retraining saved$3,500
Recruitment cost($1,200)
––––––––
T otal cost($3,700)
Note 5.Supplier payments:
DW ($)WM ($)TD ($)Net cost Discount Gross cost
($)level($) Current buying cost350,000600,00060,0001,010,0005%1,063,158
Loss of TD(60,000)(60,000)5%(63,158)
Loss of related sales at cost(17,500)(30,000)(47,500)5%(50,000)
New buying cost921,5003%950,000
Difference in net cost88,500
Note 6:There will be no saving or cost here as the supervisor will continue to be fully employed.
An alternative approach is possible to the above problem:
Cash flow Ref Amount ($)
Lost contribution –TD Note 712,000
Lost contribution – other products Note 8(71,000)
Redundancy and recruitment Note 4 above(3,700)
Lost discount Note 9(19,000)
Sublet income12,000
Supervisor Note 6 above0
––––––––
Net cash flow(69,700)
––––––––
Note 7:There will be a saving on the contribution lost on the TD of 1,200 units x $10 per unit = –$12,000
Note 8:The loss of sales of other products will cost a lost contribution of 5% ((5,000 x $80) + (6,000 x $170)) = $71,000 Note 9
DW WM TD Total (net)Discount Total gross Current buying cost350,000600,00060,0001,010,0005%1,063,158
Saved cost(17,500(30,000)(60,000)
New buying cost332,500(570,000)0902,5005%950,000
921,5003%950,000 Lost discount(19,000)
(b)Complementary pricing
Since the washing machine and the tumble dryer are products that tend to be used together, Stay Clean could link their sales with a complementary price. For example they could offer customers a discount on the second product bought, so if they buy (say) a TD for $80 then they can get a WM for (say) $320. Overall then Stay Clean make a positive contribution of $130 (320 + 80 –180 –90).
Product line pricing
All the products tend to be related to each other and used in the utility room or kitchen. Some sales will involve all three products if customers are upgrading their utility room or kitchen for example. A package price could be offered and as long as Stay Clean make a contribution on the overall deal then they will be better off.
(c)Outsourcing requires consideration of a number of issues (only 3 required):
–The cost of manufacture should be compared to cost of buying in from the outsourcer. If the outsourcer can provide the same products cheaper then it is perhaps preferable
–The reliability of the outsourcer should be assessed. If products are delivered late then the ultimate customer could be disappointed. This could damage the goodwill or brand of the business.
–The quality of work that the outsourcer produces needs to be considered. Cheaper products can often be at the expense of poor quality of materials or assembly.
–The loss of control over the manufacturing process can reduce the flexibility that Stay Clean has over current production.
I f Stay Clean wanted, say, to change the colour of a product then at present it should be able to do that. Having
contracted with an outsourcer this may be more difficult or involve penalties.
Fundamentals Level – Skills Module, Paper F5
Performance Management December 2009 Marking Scheme
Marks
1(a)Price variance2 Usage variance2
–––
4
(b)Planning price variance2
Planning usage variance2
Operational price variance2
Operational usage variance2
–––
8
(c)Explanation of external problems beyond control of manager4
Assessment of factors within the control of the manager4
Conclusion1
–––Maximum8
–––Total20
–––
2(a)Frame cost1 Leather cost2
Labour average time for 128 units1
Labour total time for 128 units1
Average cost per chair1
T arget cost1
Cost gap1
–––
8
(b)Per suggestion 1·5
–––
6
(c)Frame0·5
Leather0·5
Average time per unit2
T otal time 1
Time for 128th chair1
Conclusion1
–––
6
–––Total20
–––
3(a)Calculation of trend figures1 Adjustment for seasonal variation2
T otal tonnage for budget1
–––
4
(b)Completion of table with X, Y, XY and X24
Calculation of (b)2
Calculation of (a)2
Allowance for inflation2
–––
10
(c)Per advantage/disadvantage1·5
–––
6
–––Total20
–––
Marks 4(a)Sales growth3 Maintenance3
Directors pay2
Wages2
Net profit2
Return on assets2
–––
14
(b)Reliability of rides2
Average queuing time2
Each risk1
–––Maximum 6
–––Total20
–––
5(a)Lost revenue2 Saved labour cost2
Lost contribution from other products2
Redundancy and recruitment cost2
Supplier payments3
Sublet income1
Supervisor1
–––Maximum13
(b)Complementary pricing2
Product line pricing2
Other valid suggestions2
–––Maximum4
(c)Per issue1
–––
3
–––Total20
–––