Market Risk


Computer Practical 2
1.RiskMetrics Model
An FI wants to obtain the DEAR on its trading portfolio. The portfolio consists of the following securities.
Fixed-income securities:
i) The FI has a $1 million position in a six-year zero bonds with a face value of $1,543,302. The bond is trading at a yield to maturity of 7.50 percent. The historical mean change in daily yields is 0.0 percent, and the standard deviation is 22 basis points.
ii) The FI also holds a 12-year zero bond with a face value of $1,000,000. The bond is trading at
a yield to maturity of 6.75 percent. The price volatility if the potential adverse move in yields is
65 basis points.
Foreign exchange contracts:
The FI has a 3.5 million long trading position in spot euros at the close of business on a particular day. The exchange rate is €1.40/$1, or $0.714286/€, at the daily close. Looking back at the daily changes in the exchange rate of the euro to dollars for the past year, the FI finds that the volatility or standard deviation (σ) of the spot exchange rate was 55.5 basis points (bp).
Equities:
The FI holds a $2.5 million trading position in stocks that reflect the U.S. stock market index (e.g., the S&P 500). The β = 1. Over the last year, the standard deviation of the stock market index was 175 basis points.
Correlations (ρij) among Assets
12-year, zero-coupon C C-.3 .45
€/$ C C C .25
a 10-day period on the basis of 90% confidence limit respectively. Place your answers in the grey area provided in the Excel document. (NOTE: Your answers MUST show all the formula/working procedure.)
2. Historic or Back Simulation
Export Bank has a trading position in Japanese yen and Swiss francs. At the close of business on February 4, the bank had ¥300 million and SF10 million. The exchange rates for the most recent six days are given below:
Exchange Rates per U.S. Dollar at the Close of Business
2/4 2/3 2/2 2/1 1/29 1/28
Japanese yen 112.13 112.84 112.14 115.05 116.35 116.32
Swiss francs 1.4140 1.4175 1.4133 1.4217 1.4157 1.4123
Identify the worst-case day following the process in the new sheet “Question 2” of Excel.
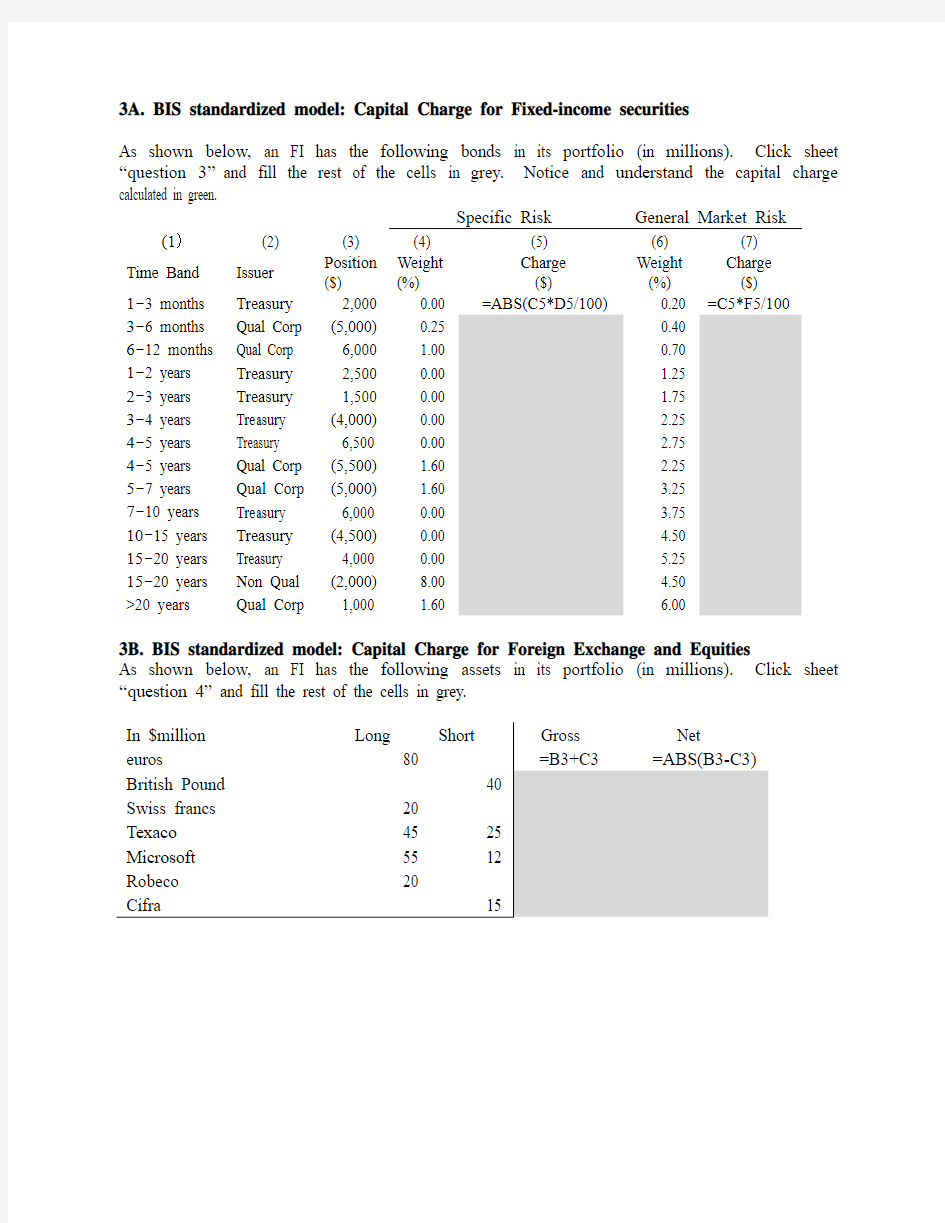
3A. BIS standardized model: Capital Charge for Fixed-income securities
As shown below, an FI has the following bonds in its portfolio (in millions). Click sheet “question 3”and fill the rest of the cells in grey. Notice and understand the capital charge calculated in green.
Specific Risk General Market Risk
(1)(2) (3) (4) (5) (6) (7)
Time Band Issuer Position
($)
Weight
(%)
Charge
($)
Weight
(%)
Charge
($)
1-3 months Treasury 2,000 0.00 =ABS(C5*D5/100) 0.20 =C5*F5/100
3-6 months Qual Corp (5,000) 0.25 0.40
6-12 months Qual Corp 6,000 1.00 0.70
1-2 years Treasury 2,500 0.00 1.25
2-3 years Treasury 1,500 0.00 1.75
3-4 years Treasury (4,000) 0.00 2.25
4-5 years Treasury 6,500 0.00 2.75
4-5 years Qual Corp (5,500) 1.60 2.25
5-7 years Qual Corp (5,000) 1.60 3.25
7-10 years Treasury 6,000 0.00 3.75
10-15 years Treasury (4,500) 0.00 4.50
15-20 years Treasury 4,000 0.00 5.25
15-20 years Non Qual (2,000) 8.00 4.50
>20 years Qual Corp 1,000 1.60 6.00
3B. BIS standardized model: Capital Charge for Foreign Exchange and Equities
As shown below, an FI has the following assets in its portfolio (in millions). Click sheet “question 4” and fill the rest of the cells in grey.
