Toward a statistical knowledge network

Toward a Statistical Knowledge Network
Gary Marchionini1, Stephanie Haas1, Catherine Plaisant2, Ben Shneiderman2, & Carol Hert3 UNC-Chapel Hill1University of Maryland2Syracuse University3
[march, haas]@https://www.wendangku.net/doc/9b16827329.html,, [plaisant, ben]@https://www.wendangku.net/doc/9b16827329.html,, cahert@https://www.wendangku.net/doc/9b16827329.html,
https://www.wendangku.net/doc/9b16827329.html,/govstat
Abstract
This paper describes an architecture for a statistical knowledge network that depends on user interfaces as the glue among the components. These interfaces aim to serve non-expert users with diverse needs and statistical and computing experiences. Such interfaces are crucially dependent on different indexing schemes and good metadata.
Statistics support planning and decision making and enormous efforts are made to collect data and produce statistics at all levels of governance. An important principle of democratic societies is that government statistics should be accessible to the broadest possible constituencies to empower better plans and decisions in all aspects of life. Given the potential of near-ubiquitous Internet access in homes and workplaces and efforts by government agencies to mount websites, physical access to large volumes of government is close to a fait accompli. What remains a significant challenge is enabling access to the right statistical information at the right time and in the right form. This challenge has several facets with accompanying implications: 1.) There is a massive volume of federal, state, and local statistical information; finding the right data imposes a requirement for good filtering support. 2.) Federal, state, and local statistical providers use a variety of standards, formats, terminology, and practices for collecting and disseminating statistics; making these data appear seamless requires metadata interoperation. 3.) The full population includes people with diverse user needs, experiences, and technological platforms; serving the full range of people from novice to expert raises the need for multiple, alternative solutions. 4.) The level of statistical/numerical literacy in the population is generally low; helping people to find and understand statistical information implies providing online help and support.
These challenges will be met over time by education and better systems. One approach to incorporate a learning population with improving technology is to create a statistical knowledge network (SKN). There is substantial literature on knowledge management (e.g., Nonaka, 1991; Davenport & Prusak, 1997; McInerney, 2002) that speaks to the need to integrate information processes together with information products. A statistical knowledge network must likewise incorporate the people and processes that gather, analyze, manage, and report statistical information into an accessible framework. From the end user’s perspective, such a network should also be concept-based rather than file-based.
Our approach is to envision user interfaces as the glue in the SKN. User interfaces are not simply front ends to client-side services pasted on in ad hoc fashion, but rather integrally coupled data and agile user-controllable mechanisms. Our design is driven by several principles (Shneiderman, 1998):?Practice user-centered design driven by needs analysis (know the user)
?Provide alternative views and control mechanisms (support universal access)
?Strive for highly interactive systems that allow penalty-free explanations and look aheads (create direct manipulation, dynamic query interfaces)
?Map specialized vocabularies to end-user vocabularies
?Provide on-demand help and support
?Usability test designs at all stages of development.
Our aim is to empower people to “find what they need and understand what they find.” Such designs present several challenges. Our experience with highly interactive interfaces in a variety of settings (Shneiderman, 1997; Plaisant et al. 1997a, 1997b; Greene et al., 2000; Marchionini et al., 2000) demonstrate the urgency of good, consistent metadata that can be transferred to the client for easy
manipulation. A related requirement is to develop useful partitions of the data to help users
visualize/recognize what is and is not available. With these principles and requirements as motivation, we have initiated five threads of work outlined below: user needs scenarios, metadata development, information architecture, vocabulary and concept maps, and online help. These underlying research threads provide the infrastructure for novel interface designs. This paper first presents an architectural overview of our vision of a SKN and then outlines progress on these research threads and preliminary user interfaces that take advantage of this work.
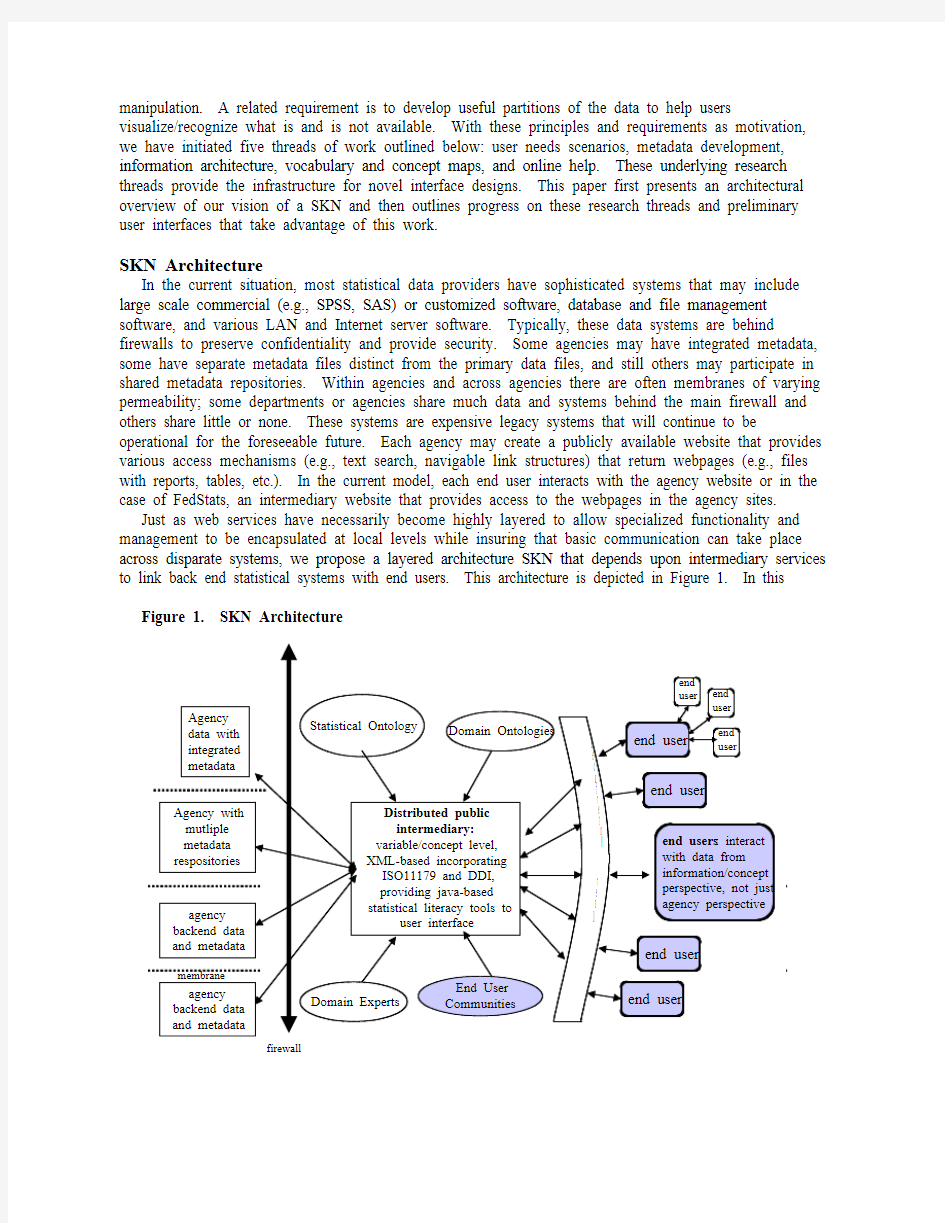
SKN Architecture
In the current situation, most statistical data providers have sophisticated systems that may include large scale commercial (e.g., SPSS, SAS) or customized software, database and file management software, and various LAN and Internet server software. Typically, these data systems are behind firewalls to preserve confidentiality and provide security. Some agencies may have integrated metadata, some have separate metadata files distinct from the primary data files, and still others may participate in shared metadata repositories. Within agencies and across agencies there are often membranes of varying permeability; some departments or agencies share much data and systems behind the main firewall and others share little or none. These systems are expensive legacy systems that will continue to be operational for the foreseeable future. Each agency may create a publicly available website that provides various access mechanisms (e.g., text search, navigable link structures) that return webpages (e.g., files with reports, tables, etc.). In the current model, each end user interacts with the agency website or in the case of FedStats, an intermediary website that provides access to the webpages in the agency sites.
Just as web services have necessarily become highly layered to allow specialized functionality and management to be encapsulated at local levels while insuring that basic communication can take place across disparate systems, we propose a layered architecture SKN that depends upon intermediary services to link back end statistical systems with end users. This architecture is depicted in Figure 1. In this Figure 1. SKN Architecture
firewall
architecture, a public intermediary integrates human resources (domain experts and end user communities that may answer questions or contribute new resources and data) with ontologies for statistical concepts and various domains (e.g., health, economics). The public intermediary is envisioned as an XML-based mapping of these resources onto cleansed data and metadata made available by participating agencies. The public intermediary supports a variety of end-user interfaces for exploring, searching, manipulating, and studying statistical concepts and associated data. Individual end users or end-user communities, or value added services use the interfaces of their choice to access all types of statistical information rather than specific interfaces for each statistical agency and data set. To date, we have made progress on each of the research threads that underlie the public intermediary and user interfaces.
Scenarios and User Needs.
User scenarios were developed early in the project to identify key issues in integration and serve as design guides for preliminary work. We aimed to identify realistic problem-based scenarios that would require statistical data from multiple agencies, across multiple levels of government. We conducted brainstorming sessions (via email) with our agency partners to identify interesting and typical situations. These were refined to fifteen scenarios after preliminary discussions and searches. A template to collect data was developed and searches in the WWW and commercial indexes were conducted to find pertinent data for ‘answering’ five of the scenarios. The details of these efforts are given in a working paper available at https://www.wendangku.net/doc/9b16827329.html,/govstat/papers/scenario_paper_nov_14_2002.doc. We used the results to query agency partners about what data they could provide that would meet the needs expressed in the scenarios. These scenarios demonstrated the many facets of questions and possibly pertinent information, the range of public and private resources available, and the difficulties associated with vocabulary, quality assurance, and acquiring the actual data from various sources. In addition to the scenario development, a user study of the FedStats website was conducted to test how well people are able to understand vocabulary in its index (Ceapura, 2003).
Metadata
Metadata sits at the heart of the SKN. We have been investigating metadata options available in the statistical community (e.g., the Data Documentation Initiative and the ISO 11179 standard), what metadata exists in our partner agency systems, and have conducted a user study on what metadata experts and novices find useful for different statistical problems. See https://www.wendangku.net/doc/9b16827329.html,/~ohjs/stats.html for a primer on statistical metadata standards and sources, Hert and Haas (this conference) for results from the metadata study and https://www.wendangku.net/doc/9b16827329.html,/govstat/papers/hert-statistics.ppt for a recent presentation. Our goal is twofold: to leverage metadata to build easy to use search and browse services for the SKN; and to provide explanatory information at the survey, variable, and statistic levels to help people understand the data they find.
Information Architecture
Alternative ways to slice and dice large data sets address user diversity as well as helping all individuals to understand the overall structure of the data. Organizing and naming data and their anchors are the key challenges of Information Architecture (IA) and a classical problem of indexing. A research team conducted an intensive investigation of the Energy Information Administration (EIA) website with the aims of becoming intimate with the details of tens of thousands of webpages and creating a concept map of what is included. The resulting three tiered organization (Fry & Su, 2003) will serve as an alternative view to the current EIA website and also be the basis for instantiating one of the interface prototypes (Relation Browser).
Hand-crafting an organization and set of identifiers for a large website (let alone for the aggregation of all these sites that would feed the SKN), is extremely expensive and difficult to scale. We have been
investigating different ways to automatically categorize all the objects in a website. Our first approach was to crawl an agency website (BLS), take the 100K+ unique strings and after a set of reductions (locate words using WordNet, stem, apply stop list), compute term frequency (tf), term-document frequency (tdf), and term-frequency/inverse document frequency (TFIDF) for each term. The TFIDF term-document matrix was projected onto the first 100 principal components of the terms, and this result was subjected to k-means clustering with and without the 100 most commonly occurring terms in the collection. The resulting clusters yielded promising ‘slices’ through the corpus and we are experimenting with labeling techniques combining manual and automatic (e.g., centroid based) methods. The goal is to automatically create an organization and labeling scheme that can be compared to manual and agency-created schemes. The comparisons will be made using the Relation Browser and other UI prototypes. Vocabulary
We have begun developing a statistical ontology to relate statistical concepts. See
https://www.wendangku.net/doc/9b16827329.html,/govstat/papers/Santa-Fe012303.ppt for an overview of the plan and status. A first step is to create a statistical glossary and begin to develop graphical explanations (including flash animations to explain concepts such as ‘seasonally adjusted.’ The ontology supports the creation of explanations and will allow users to explore statistical concepts and the relationships between them. Classes of terms include: statistical concepts, date/time, geography, topics, and user terms. We are investigating the following types of representations for definitions: examples, brief tutorials, demonstrations, interactive simulations, pointers to related concepts, and live links to community or agency personnel (Haas et al., in review).
Help
The WWW environment is mainly self serve—online help has been largely ignored. We aim to address this by developing help and support services for the SKN. One approach is to use context-dependent sticky note help (see Plaisant et al., 2003) to provide on-demand help for users. We are investigating animated demos (see Dominick et al., 2003) as a technique as well. The animated glossary help noted above is another approach. Finally, we will investigate ways to link metadata (e.g., source, units of measure, expanded explanation) to data values to help people understand what they have found. User Interface Prototypes
The research threads above are meant to support highly interactive interfaces. We have initiated several prototype designs that support dynamic interaction with data. Figures 2-6 depict our preliminary designs. Figure 2 shows one version of the Relation Browser (Marchionini & Brunk, in press) that allows users to mouse over attributes in a column of values and see how many objects exist for each category (slice) through the database on another set of attributes. Clicking on one of the bars returns the objects. Figure 3 shows a more advanced version that allows users to explore topical as well as numeric and geographical attribute sets through mouse over mechanisms. Figure 4 shows a geographic map that displays results for a variety of attributes set through sliders and other control mechanisms (Golub & Shneiderman, 2002). Figure 5 shows a network view of the relationships in a data set. Users can change the level of detail rotate or zoom to investigate relationships in the webpages or data objects. Figure 6 shows an example of dynamic, context specific sticky note help (Plaisant et al., 2003).
Summary and Current Status
In addition to the different work summarized above, we aim to foster relationships with federal and state agencies. One immediate goal is to continue to acquire data sets and the appropriate metadata that can be incorporated in the interface prototypes. Some current issues we aim to address in the coming year include: What metadata are most crucial for end user access and understanding? How can metadata be integrated across agencies without waiting for all to adopt a common standard? As we scale automatic
classification to multiple agency data sets, should the data be merged before clustering or can we cluster on each agency and then merge results (much easier computationally)? What multi-layered help strategies are most effective? What data objects will be the appropriate and practical units of analysis for design (files, variables, concepts)? As the user interface prototypes are populated with data sets, we will conduct user studies to assess their effectiveness and guide subsequent designs.
A SKN is an ambitious undertaking. Our partner agencies (BLS, Census, EIA, NASS, NCHS, and SSA) have shown great willingness to collaborate toward this goal and we have begun discussions with some state-level agencies. The FedStats consortium has demonstrated that the federal statistical community has the will and skill to work together to better serve people’s statistical information needs. Their willingness to work toward a SKN is the logical extension to the success of FedStats and promises to serve even wider portions of the population in the years ahead.
Acknowledgements: This work is supported by NSF In-Collaboration Grants EIA 0131824 and EIA 0129978.
References
1. Ceaparu, I. (2003). Governmental Statistical Data on the Web: A Case Study of FedStats. IT& Society, 3(1), 1-17. https://www.wendangku.net/doc/9b16827329.html,
2. Davenport, T. & Prusak, L. (1997). Information ecology, NY: Oxford University Press.
3. Dominick, J. Hughes, A. Marchionini, G. Shearer, T. Su, C. and Zhang, J. Portal Help: Helping People Help Themselves Through Animated Demos. February 2003. UNC-CH Tech. Report SILS TR-2003-01.
4. Fry, J. & Su, C. (2003). Methodological challenges in information architecture: Adventures in re-indexing federal statistical websites to enhance access to end users. Poster presented at the Fourth Information Architecture Summit. Portland, OR (March 2003).
5. Greene, S., Marchionini, G., Plaisant, C., & Shneiderman, B. (2000). Previews and overviews in digital libraries: Designing surrogates to support visual information seeking. Journal of the American Society for Information Science, 51(4), 380-393.
6. Golub, E. & Shneiderman, B. (2002). Dynamic query visualizations on world wide web clients: A DHTML solution for maps and scattergrams. Technical Report: HCIL-2002-08 , CS-TR-4367 , UMIACS-TR-2002-4
7. https://www.wendangku.net/doc/9b16827329.html,/local-cgi-bin/hcil/sr.pl?date=golub
7. Haas, S., Patteulli, C., & Brown, R. (in review). Understanding Statistical Concepts and Terms in Context: The GovStat Ontology and the Statistical Interactive Glossary. Submitted to the ASIST 2003 Annual Conference.
8. Marchionini, G. & Brunk, B. (in press). Toward a General Relation Browser: A GUI for Information Architects. Journal of Digital Information.
9. Marchionini, G., Brunk, B., Komlodi, A., Conrad, F., & Bosley, J. (2000). Look Before You Click: A Relation Browser for Federal Statistics Websites. Proceedings of the Annual Meeting of the American Society for Information Science (Chicago,, Nov. 12-16, 2000), 392-402.
10. McInerney, C. (2002). Knowledge management and the dynamic nature of knowledge. Journal of the American Society for Information Science, 53(12), 1009-1018.
11. Nonaka, I. (1991). The knowledge creating company. Harvard Business Review, 79(1), 96-104.
12. Plaisant, C., Kang, H., Shneiderman, B., Helping users get started with visual interfaces: multi-layered interfaces, integrated initial guidance and video demonstrations, to appear in Proceedings of 10th International Conference on Human-Computer Interaction, Crete, Greece, 22-27 June 2003.
13. Plaisant, C., Marchionini, G., Bruns, T., Komlodi, A., & Campbell, L. (1997a). Bringing treasures to the surface: Iterative design for the Library of Congress National Digital Library Program. ACM CHI ‘97 Conference. (Atlanta, March 22-27, 1997), p. 518-525.
14. Plaisant, C., Shneiderman, B., and Muhslin, R. (1997b) An Information Architecture to Support the Visualization of Personal Histories. Information Processing & Management, 34, 5, pp. 581-597, 1998.
15. Shneiderman, B., Designing the User Interface: Strategies for Effective Human-Computer Interaction: Third Edition, Addison-Wesley Publ. Co., Reading, MA (1998).
16. Shneiderman, B. (1997). Direct Manipulation for Comprehensible, Predictable, and Controllable User Interfaces. Proceedings of IUI97, 1997 International Conference on Intelligent User Interfaces, Orlando, FL, January 6-9, 1997, 33-39.
Figure 2. Relation Browser A Figure 3. Visual Information Browser A
Figure 4.Interactive Map
Figure 5. TableHunter Figure 6. Sticky-Note Help
管理运筹学期末试卷B
一、 二、 三、 填空题(每小题 分,共 ?分) 、设原??问题为?????? ?≥-=++-≥--≤++++-= ,0,5232 4 7 532min 3213213213213 21无约束x x x x x x x x x x x x x x x Z 则它的标准形和对偶规划问题分别为:________________________ 和 ________________________。 、用分枝定界法求整数规划12 12121121min 5 2 56 30 4,0Z x x x x x x x x x x =---≥-??+≤?? ≤??≥?且为整数 的解时,求得放松问题的解为? = ? ? ? ? ? ?,则可将原问题分成如下两个子问题 与 求解。 、右图的最小支撑图是。 、右边的网络图是标号算法中的图,其中每条弧上的数 表示其容量和流量。该图中得到的可行流的增广链 (-3,1) (2,1) ②5(4) ④ ① 6(6) 6(4) ⑥ (0, ∞) 8(8) 3(2 ) 9(9)(5,1)
为: ,在其上可增的最大流量 为 。 、已知某线性规划问题,最优单纯形表如下 则其最优解为: ,最优值 max Z 。 二、单项选择题(每小题 分,共 分) 、下列表格是对偶单纯形表的是( ? )
、关于线性规划模型的可行域,叙述正确的为( ) ?、可行域必有界; 、可行域必然包括原点; 、可行域必是凸的; 、可行域内必有无穷多个点。 、在运输问题中如果总需求量大于总供应量,则求解时应( ) ?、虚设一些供应量; ?、虚设一个供应点; 、根据需求短缺量,虚设多个需求点; ?、虚设一个需求点。 、下列规划问题不可用动态规划方法求解的是( ) ?、背包问题; ?、最短路径问题 、线性规化: ???≥≥=++++=0 ,010 34..max 321 3 32211y x x x x t s x c x c x c Z ?、22 min (,)(2)3(1).. 460,0f x y x y s t xy y x y ?=++-?+
北师大版七年级数学下册三角形难题全解
的度数;
三角形强化训练和深化 ? 1、如图a 是长方形纸带,∠DEF=25°,将纸带沿EF 折叠成图b ,再沿BF 折叠成图c ,则图c 中的∠CFE 的度数是_________°. 解析: 由题意可知折叠前,由BC//AD 得: ∠BFE=∠DEF=25°将纸带沿EF 折叠成图b 后, ∠GEF=∠DEF=25° 所以图b 中,∠DGF=∠GEF+∠BFE=25°+25°=50° 又在四边形CDGF 中,∠C=∠D=90° 则由:∠DGF+∠GFC=180° 所以:∠GFC=180°-50°=130° 将纸带再沿BF 第二次折叠成图C 后 ∠GFC 角度值保持不变 且此时:∠GFC =∠EFG+∠CFE 所以:∠CFE=∠GFC-∠EFG=130°-25°=105 2、在Rt △ABC 中,∠A =90°,CE 是角平分线,和高AD 相交于F ,作FG ∥BC 交AB 于G ,求证:AE =BG . 解法1: 【解析】证明:∵∠BAC=900 AD ⊥BC ∴∠1= ∠B ∵CE 是角平分线 ∴∠2=∠3 ∵∠5=∠1+∠2 ∠4=∠3+∠B ∴∠4=∠5 ∴AE =AF
过F作FM⊥AC并延长MF交BC于N ∴MN//AB ∵FG//BD ∴四边形GBDF为平行四边形 ∴GB=FN ∵AD⊥BC,CE为角平分线 ∴FD=FM 在Rt△AMF和RtNDF中 ∴△AMF≌△NDF ∴AF=FN ∴AE=BG 解法2: 解:作EH⊥BC于H,如图, ∵E是角平分线上的点,EH⊥BC,EA⊥CA, ∴EA=EH, ∵AD为△ABC的高,EC平分∠ACD, ∴∠ADC=90°,∠ACE=∠ECB, ∴∠B=∠DAC, ∵∠AEC=∠B+∠ECB, ∴∠AEC=∠DAC+∠ECA=∠AFE, ∴AE=AF, ∴EG=AF, ∵FG∥BC, ∴∠AGF=∠B, ∵在△AFG和△EHB中, ∠GAF=∠BEH ∠AGF=∠B AF=EH ,∴△AFG≌△EHB(AAS) ∴AG=EB, 即AE+EG=BG+GE, ∴AE=BG. 3、如图,等腰直角三角形ABC中,∠ACB=90°,AD为腰CB上的中线,CE⊥AD交AB 于E.求证∠CDA=∠EDB.
web of science中文使用手册
Web of Science 中文使用手冊
目次 Welcome to the Web of Science (2) ISI Web of Knowledge介紹 (3) Cross Search 跨資料庫檢索 (4) 簡易Cross Search (4) 詳細Cross Search (4) 檢索結果 (6) ISI Web of Knowledge檢索結果 (6) 勾選清單 (7) 全記錄—以WOS為例 (7) External Collections 檢索結果 (8) WOK平台個人化功能 (9) Register註冊個人帳號 (9) Web of Science首頁 (11) 進入ISI Web of Knowledge (11) 進入Web of Science首頁 (12) 選擇資料庫和時間 (12) Quick Search快速查詢 (12) General Search (13) 檢索結果 (16) Full Record全記錄 (18) 引用文獻(Cited Reference) (19) 被引用文獻(Time Cited) (20) 共同引用記錄(Related Record) (21) Citation Alert (21) 檢索技巧 (23) 被引用參考文獻查詢(Cited Reference Search) (27) 進階檢索(Advanced Search) (30) 結構式查詢(Structure Search) (30) 檢索歷史 (32) Combine Sets結合檢索策略 (32) Save History儲存檢索歷史 (33) Open Saved History開啟已儲存檢索歷史 (34) 管理在ISI Web of Knowledge Server上的檢索歷史 (37) Mark List勾選清單 (38) 附錄一 (40) Contacting Us 聯絡我們 (40) 1
管理运筹学期中复习题答案
《管理运筹学》期中测试题 第一部分 线性规划 一、填空题 1.线性规划问题是求一个 目标函数 在一组 约束条件 下的最值问题。 2.图解法适用于含有 两个 _ 变量的线性规划问题。 3.线性规划问题的可行解是指满足 所有约束条件_ 的解。 4.在线性规划问题的基本解中,所有的非基变量等于 零 。 5.在线性规划问题中,基本可行解的非零分量所对应的列向量线性 无 关 6.若线性规划问题有最优解,则最优解一定可以在可行域的 顶点_ 达到。 7.若线性规划问题有可行解,则 一定 _ 有基本可行解。 8.如果线性规划问题存在目标函数为有限值的最优解,求解时只需在其 可行解 的集合中进行搜索即可得到最优解。 9.满足 非负 _ 条件的基本解称为基本可行解。 10.在将线性规划问题的一般形式转化为标准形式时,引入的松驰变量在目标函数中的系数为 正 。 11.将线性规划模型化成标准形式时,“≤”的约束条件要在不等式左_端加入 松弛 _ 变量。 12.线性规划模型包括 决策变量 、目标函数 、约束条件 三个要素。 13.线性规划问题可分为目标函数求 最大 _ 值和 最小 _值两类。 14.线性规划问题的标准形式中,约束条件取 等 _ 式,目标函数求 最大 _值,而所有决策变量必须 非负 。 15.线性规划问题的基本可行解与基本解的关系是 基本可行解一定是基本解,反之不然 16.在用图解法求解线性规划问题时,如果取得最值的等值线与可行域的一段边界重合,则 _ 最优解不唯一 。 17.求解线性规划问题可能的结果有 唯一最优解,无穷多最优解,无界解,无可行解 。 18.如果某个约束条件是“ ”情形,若化为标准形式,需要引入一个 剩余 _ 变量。 19.如果某个变量X j 为自由变量,则应引进两个非负变量X j ′ , X j 〞, 同时令X j = X j ′ - X j 〞 j 。 20.表达线性规划的简式中目标函数为 线性函数 _ 。 21.线性规划一般表达式中,a ij 表示该元素位置在约束条件的 第i 个不等式的第j 个决策变量的系数 。 22.线性规划的代数解法主要利用了代数消去法的原理,实现_ 基变量 的转换,寻找最优解。 23.对于目标函数最大值型的线性规划问题,用单纯型法代数形式求解时,当非基变量检验数_ 非正 时,当前解为最优解。 24.在单纯形迭代中,选出基变量时应遵循_ 最小比值 法则。 二、单选题 1. 如果一个线性规划问题有n 个变量,m 个约束方程(m 图2图图 期末检测题 【本检测题满分:120分,时间:120分钟】 一、选择题(每小题3分,共30分) 1.(2013?湖南张家界中考)-2 013的绝对值是( ) A.-2 013 B.2 013 C. D.12013 12013 -2.已知两数在数轴上的位置如图所示,则化简代数式,a b 的结果是( ) 12a b a b +--++A.1 B. C. D.-1 23b +23a -3.某商店把一件商品按标价的九折出售(即优惠10%),仍可获利20%,若该商品的标价为每件28元,则该商品的进价为( ) A.21元 B.19.8元 C.22.4元 D.25.2元 4.(2013?湖南株洲中考)一元一次方程的解是( ) 24x =A. B. C. D.1x =2x =3x =4 x =5.如图,,则与之比为( )11,,34 AC AB BD AB AE CD ===CE AB A.1∶6 B.1:8 C.1:12 D.1:16 6.如果∠1与∠2互补,∠2与∠3互余,则∠1与∠3的关系是( ) A.∠1=∠3 B.∠1=180°-∠3 C.∠1=90°+∠3 D.以上都不对 7.如图是某班学生参加课外兴趣小组的人数占总人数比 例的统计图,则参加人数最多的课外兴趣小组是( ) A.棋类组 B.演唱组 C.书法组 D.美术组 8.某中学开展“阳光体育活动”,九年级一班全体同学分别参加了巴 山舞、乒乓球、篮球三个项目的活动,陈老师统计了该班参加这三项活动的人数,并绘制了如图所示的条形统计图和扇形统计图.根据这两个统计图,可以知道该班参加乒乓A B C D E 第5题图 习题到位。在管设备进行调整使度内来确保机组 最新版人教版七年级数学下册知识点 第五章相交线与平行线 一、知识网络结构 相交线 相交线垂线 同位角、内错角、同旁内角 平行线:在同一平面内,不相交的两条直线叫平行线 定义 : __________ __________ ________ 平行线及其判定判定 1:同位角相等,两直线平行 判定 2 平行线的判定:内错角相等,两直线平行 相交线与平行线判定 3:同旁内角互补,两直线平行 判定 4:平行于同一条直线的两直线平行 平行线的性质性质 1:两直线平行,同位角 性质 2:两直线平行,内错角 性质 3:两直线平行,同旁内 性质 4:平行于同一条直线 相等 相等 角互补 的两直线平行命题、定理 平移 二、知识要点 1、在同一平面内,两条直线的位置关系有两种:相交和平行,垂直是相交的一种特殊情况。 2、在同一平面内,不相交的两条直线叫平行线。如果两条直线只有一个公共点,称这两条直线相交;如果两条直线没有公共点,称这两条直线平行。 3、两条直线相交所构成的四个角中,有公共顶点且有一条公共边的两个角是邻补角。邻补角的性质:邻补角互补。如图 1 所示,与互为邻补角,与互为邻补角。+=180°;+ =180° ; + =180°;+ =180°。321 4 4、两条直线相交所构成的四个角中,一个角的两边分别是另一个角的两边的图 1反 向延长线,这样的两个角互为对顶角。对顶角的性质:对顶角相等。如图1 所示,与互为对顶角。=; =。 5、两条直线相交所成的角中,如果有一个是直角或90° 时,称这两条直线互相垂直, 其中一条叫做另一条的垂线。如图 2 所示,当= 90°时,⊥b。 a 垂线的性质:2 1 3 4 性质 1:过一点有且只有一条直线与已知直线垂直。 图 2 性质 2:连接直线外一点与直线上各点的所有线段中,垂线段最短。 性质 3:如图 2 所示,当 a⊥ b 时,==== 90°。点到直线的距离:直线外一点到这条直线的垂线段的长度叫点到直线的c距离。 6、同位角、内错角、同旁内角基本特征:21 3 46 a 75 8 ①在两条直线 ( 被截线 ) 的同一方,都在第三条直线 ( 截线 ) 的同一侧,这样 b 同位角。图 3 中,共有图 3 的两个角叫对同位角:与是同位角; 与是同位角;与是同位角;与是同位角。 ②在两条直线 ( 被截线 )之间,并且在第三条直线 ( 截线 ) 的两侧,这样的两个角叫内错角。图 3中,共有对内错角:与是内错角;与是内错角。 ③在两条直线 ( 被截线 ) 的之间,都在第三条直线 ( 截线 ) 的同一旁,这样的两个角叫同旁内角。图 3中,共有对同旁内角:与是同旁内角;与是同旁内角。 7、平行公理:经过直线外一点有且只有一条直线与已知直线平行。 平行公理的推论:如果两条直线都与第三条直线平行,那么这两条直线也互相 平行。c 2 3 1 4 6 5 平行线的性质:a78性质 1:两直线平行,同位角相等。如图 4 所示,如果 a∥ b,图4 b 则 =; =; =; =。 四 川 大 学 网 络 教 育 学 院 模 拟 试 题( A ) 《管理运筹学》 一、 单选题(每题2分,共20分。) 1.目标函数取极小(minZ )的线性规划问题可以转化为目标函数取极大的线性规 划问题求解,原问题的目标函数值等于( C )。 A. maxZ B. max(-Z) C. –max(-Z) D.-maxZ 2. 下列说法中正确的是( B )。 A.基本解一定是可行解 B.基本可行解的每个分量一定非负 C.若B 是基,则B 一定是可逆D.非基变量的系数列向量一定是线性相关的 3.在线性规划模型中,没有非负约束的变量称为 ( D ) 多余变量 B .松弛变量 C .人工变量 D .自由变量 4. 当满足最优解,且检验数为零的变量的个数大于基变量的个数时,可求得( A )。 A.多重解 B.无解 C.正则解 D.退化解 5.对偶单纯型法与标准单纯型法的主要区别是每次迭代的基变量都满足最优检验但不完全满足 ( D )。 A .等式约束 B .“≤”型约束 C .“≥”约束 D .非负约束 6. 原问题的第i个约束方程是“=”型,则对偶问题的变量i y 是( B )。 A.多余变量 B.自由变量 C.松弛变量 D.非负变量 7.在运输方案中出现退化现象,是指数字格的数目( C )。 A.等于m+n B.大于m+n-1 C.小于m+n-1 D.等于m+n-1 8. 树T的任意两个顶点间恰好有一条( B )。 A.边 B.初等链 C.欧拉圈 D.回路 9.若G 中不存在流f 增流链,则f 为G 的 ( B )。 A .最小流 B .最大流 C .最小费用流 D .无法确定 10.对偶单纯型法与标准单纯型法的主要区别是每次迭代的基变量都满足最优检验但不完全满足( D ) A.等式约束 B.“≤”型约束 C.“≥”型约束 D.非负约束 二、多项选择题(每小题4分,共20分) 1.化一般规划模型为标准型时,可能引入的变量有 ( ) A .松弛变量 B .剩余变量 C .非负变量 D .非正变量 E .自由变量 2.图解法求解线性规划问题的主要过程有 ( ) A .画出可行域 B .求出顶点坐标 C .求最优目标值 D .选基本解 E .选最优解 3.表上作业法中确定换出变量的过程有 ( ) A .判断检验数是否都非负 B .选最大检验数 C .确定换出变量 D .选最小检验数 E .确定换入变量 4.求解约束条件为“≥”型的线性规划、构造基本矩阵时,可用的变量有 ( ) A .人工变量 B .松弛变量 C. 负变量 D .剩余变量 E .稳态 变量 5.线性规划问题的主要特征有 ( ) A .目标是线性的 B .约束是线性的 C .求目标最大值 D .求目标最小值 E .非线性 三、 计算题(共60分) 1. 下列线性规划问题化为标准型。(10分) 第五章知识结构如下图所示: 第六章知识结构 第七章知识结构框图如下: (二)开展好课题学习 可以如下展开课题学习: (1)背景了解多边形覆盖平面问题来自实际. (2)实验发现有些多边形能覆盖平面,有些则不能. (3)分析讨论多边形能覆盖平面的基本条件,发现问题与多边形的内角大小有密切关系,运用多边形内角和公式对实验结果进行分析. (4)运用进行简单的镶嵌设计. 首先引入用地砖铺地,用瓷砖贴墙等问题情境,并把这些实际问题转化为数学问题:用一些不重叠摆放的多边形把平面的一部分完全覆盖.然后让学生通过实验探究一些多边形能否镶嵌成平面图案,并记下实验结果: (1)用正三角形、正方形或正六边形可以镶嵌成一个平面图案(图1).用正五边形不能镶嵌成一个平面图案. (2)用正三角形与正方形可以镶嵌成一个平面图案.用正三角形与正六边形也可以镶嵌成一个平面图案. (3)用任意三角形可以镶嵌成一个平面图案, 用任意四边形可以镶嵌成一个平面图案(图2). 观察上述实验结果,得出多边形能镶嵌成一个平面图案需要满足的两个条件: (1)拼接在同一个点(例如图2中的点O)的各个角的和恰好等于360°(周角); (2)相邻的多边形有公共边(例如图2中的OA两侧的多边形有公共边OA). 运用上述结论解释实验结果,例如,三角形的内角和等于180°,在图2中,∠1+∠2+∠3=180°.因此,把6个全等的三角形适当地拼接在同一个点(如图2), 一定能使以这点为顶点的6个角的和恰好等于360°,并且使边长相等的两条边贴在一起.于是, 用三角形能镶嵌成一个平面图案.又如,由多边形内角和公式,可以得到五边形的内角和等于 (5-2)×180°=540°. 因此,正五边形的每个内角等于 540°÷5=108°, 360°不是108°的整数倍,也就是说用一些108°的角拼不成360°的角.因此,用正五边形不能镶嵌成一个平面图案. 最后,让学生进行简单的镶嵌设计,使所学内容得到巩固与运用.1.利用二(三)元一次方程组解决问题的基本过程 2.本章知识安排的前后顺序 Web of Knowledge平台服务功能使用简介 ISI Web of Knowledge为读者提供了个性化服务和定题服务功能。个性化定制指用户可以在Web of Konwledge主页上注册并设置自己密码,然后每次登录后即可浏览自己订制主页,包括:保存检索策略、建立并编辑自己经常阅读期刊列表;浏览保存检索策略、及时了解一个定题服务是否有效及过期时间。 电子邮件定题服务可让用户方便地跟踪最新研究信息。新定题服务功能允许用户通过web of science中任一种检索途径(普通检索、引文检索、化学结构检索)创建定题服务服务策略,将检索策略保存并转化为用电子邮件通知定题服务。 如图,在Web of Knowledge主页右侧提供了个性化定制服务和定题服务管理功能,下面就这几项功能一一说明如下: 图一:web of knowledge主页 一、注册 点击“Register”超链接,进入注册页面。如图二:分别按要求填入您电子邮件地址,您选择密码以及您姓名。您可以选择自动登录或者普通方式进入您个性化服务管理功能。自动登录可以免除您每次登录Web of Knowledge平台时输入电子邮件地址和密码。该功能使用是cookie技术。如果使用公共计算机,最好选择普通登录方式。 在完成以上操作之后,点击“Submit Registration”完成整个注册过程。 图二:用户注册页面 二、登录 作为注册用户,您可以实现以下功能: ?自动登录到Web of Knowledge平台。 ?选择一个自己常用开始页面,每次登录后则自动进入该页面。 ?将检索策略保存到ISI Web of Knowledge服务器。 ?创建用户关注期刊列表以及期刊目次定题服务。 登录时,在web of knowledge主页右侧输入您电子邮件地址和密码,点击“Sign in”则可进入您个人定制信息服务管理页面。 三、个人信息管理和选择开始页面 点击“My Preferences”超链接,可以编辑个人信息和选择开始页面。 编辑个人信息: 点击“Edit my Information”超链接可以更新您联系信息,如电子邮件地址、密码及姓名。如图三。 四川大学网络教育学院模拟试题( A ) 《管理运筹学》 一、单选题(每题2分,共20分。) 1.目标函数取极小(minZ)的线性规划问题可以转化为目标函数取极大的线性规 划问题求解,原问题的目标函数值等于(C)。 A. maxZ B. max(-Z) C. –max(-Z) D.-maxZ 2.下列说法中正确的是(B)。 A.基本解一定是可行解B.基本可行解的每个分量一定非负 C.若B是基,则B一定是可逆D.非基变量的系数列向量一定是线性相关的3.在线性规划模型中,没有非负约束的变量称为( D ) 多余变量B.松弛变量C.人工变量D.自由变量 4. 当满足最优解,且检验数为零的变量的个数大于基变量的个数时,可求得 ( A )。 A.多重解B.无解C.正则解D.退化解5.对偶单纯型法与标准单纯型法的主要区别是每次迭代的基变量都满足最优检验 但不完全满足( D )。 A.等式约束 B.“≤”型约束 C.“≥”约束 D.非负约束 y是( B )。 6. 原问题的第i个约束方程是“=”型,则对偶问题的变量i A.多余变量B.自由变量C.松弛变量D.非负变量 7.在运输方案中出现退化现象,是指数字格的数目( C )。 A.等于m+n B.大于m+n-1 C.小于m+n-1 D.等于m+n-1 8.树T的任意两个顶点间恰好有一条(B)。 A.边B.初等链C.欧拉圈D.回路9.若G中不存在流f增流链,则f为G的( B )。 A.最小流 B.最大流 C.最小费用流 D.无法确定 10.对偶单纯型法与标准单纯型法的主要区别是每次迭代的基变量都满足最优检验 但不完全满足( D ) A.等式约束B.“≤”型约束C.“≥”型约束D.非负约束二、多项选择题(每小题4分,共20分) 1.化一般规划模型为标准型时,可能引入的变量有() A.松弛变量 B.剩余变量 C.非负变量 D.非正变量 E.自由变量 2.图解法求解线性规划问题的主要过程有() A.画出可行域 B.求出顶点坐标 C.求最优目标值 D.选基本解 E.选最优解 3.表上作业法中确定换出变量的过程有() A.判断检验数是否都非负 B.选最大检验数 C.确定换出变量 D.选最小检验数 E.确定换入变量 4.求解约束条件为“≥”型的线性规划、构造基本矩阵时,可用的变量有()A.人工变量 B.松弛变量 C. 负变量 D.剩余变量 E.稳态变量 5.线性规划问题的主要特征有() A.目标是线性的 B.约束是线性的 C.求目标最大值 D.求目标最小值 E.非线性 三、计算题(共60分) 1. 下列线性规划问题化为标准型。(10分) 1 / 17 第一章:整式的运算 单项式 式 多项式 同底数幂的乘法 幂的乘方 积的乘方 同底数幂的除法 零指数幂 负指数幂 整式的加减 单项式与单项式相乘 单项式与多项式相乘 整式的乘法 多项式与多项式相乘 整式运算 平方差公式 完全平方公式 单项式除以单项式 整式的除法 多项式除以单项式 一、单项式 1、都是数字与字母的乘积的代数式叫做单项式。 2、单项式的数字因数叫做单项式的系数。 3、单项式中所有字母的指数和叫做单项式的次数。 4、单独一个数或一个字母也是单项式。 5、只含有字母因式的单项式的系数是1或―1。 6、单独的一个数字是单项式,它的系数是它本身。 7、单独的一个非零常数的次数是0。 8、单项式中只能含有乘法或乘方运算,而不能含有加、减等其他运算。 9、单项式的系数包括它前面的符号。 10、单项式的系数是带分数时,应化成假分数。 11、单项式的系数是1或―1时,通常省略数字“1”。 12、单项式的次数仅与字母有关,与单项式的系数无关。 二、多项式 1、几个单项式的和叫做多项式。 2、多项式中的每一个单项式叫做多项式的项。 3、多项式中不含字母的项叫做常数项。 4、一个多项式有几项,就叫做几项式。 5、多项式的每一项都包括项前面的符号。 6、多项式没有系数的概念,但有次数的概念。 7、多项式中次数最高的项的次数,叫做这个多项式的次数。 三、整式 1、单项式和多项式统称为整式。 2、单项式或多项式都是整式。 3、整式不一定是单项式。 4、整式不一定是多项式。 5、分母中含有字母的代数式不是整式;而是今后将要学习的分式。 四、整式的加减 1、整式加减的理论根据是:去括号法则,合并同类项法则,以及乘法分配率。 2、几个整式相加减,关键是正确地运用去括号法则,然后准确合并同类项。 3、几个整式相加减的一般步骤: (1)列出代数式:用括号把每个整式括起来,再用加减号连接。 (2)按去括号法则去括号。 (3)合并同类项。 4、代数式求值的一般步骤: (1)代数式化简。 (2)代入计算 (3)对于某些特殊的代数式,可采用“整体代入”进行计算。 五、同底数幂的乘法 1、n个相同因式(或因数)a相乘,记作a n,读作a的n次方(幂),其中a为底数,n为指数,a n的结果叫做幂。 2、底数相同的幂叫做同底数幂。 3、同底数幂乘法的运算法则:同底数幂相乘,底数不变,指数相加。即:a m﹒a n=a m+n。 4、此法则也可以逆用,即:a m+n = a m﹒a n。 5、开始底数不相同的幂的乘法,如果可以化成底数相同的幂的乘法,先化成同底数幂再运用法则。 六、幂的乘方 1、幂的乘方是指几个相同的幂相乘。(a m)n表示n个a m相乘。 2、幂的乘方运算法则:幂的乘方,底数不变,指数相乘。(a m)n =a mn。 3、此法则也可以逆用,即:a mn =(a m)n=(a n)m。 七、积的乘方 1、积的乘方是指底数是乘积形式的乘方。 2、积的乘方运算法则:积的乘方,等于把积中的每个因式分别乘方,然后把所得的幂相乘。即(ab)n=a n b n。 3、此法则也可以逆用,即:a n b n =(ab)n。 八、三种“幂的运算法则”异同点 1、共同点: (1)法则中的底数不变,只对指数做运算。 (2)法则中的底数(不为零)和指数具有普遍性,即可以是数,也可以是式(单项式或多项式)。 (3)对于含有3个或3个以上的运算,法则仍然成立。 2、不同点: (1)同底数幂相乘是指数相加。 (2)幂的乘方是指数相乘。 (3)积的乘方是每个因式分别乘方,再将结果相乘。 九、同底数幂的除法 来源:2011-2012学年广东省汕头市潮南区中考模拟考试数学卷(解析版) 考点:三角形 如图,已知,等腰Rt△OAB中,∠AOB=90o,等腰Rt△EOF中,∠EOF=90o,连结AE、BF. 求证:(1)AE=BF;(2)AE⊥BF. 【答案】 见解析 【解析】解:(1)证明:在△AEO与△BFO中, ∵Rt△OAB与Rt△EOF等腰直角三角形, ∴AO=OB,OE=OF,∠AOE=90o-∠BOE=∠BOF, ∴△AEO≌△BFO, ∴AE=BF; ( 2)延长AE交BF于D,交OB于C,则∠BCD=∠ACO, 由(1)知:∠OAC=∠OBF, ∴∠BDA=∠AOB=90o, ∴AE⊥BF. (1)可以把要证明相等的线段AE,CF放到△AEO,△BFO中考虑全等的条件,由两个等腰直角三角形得AO=BO,OE=OF,再找夹角相等,这两个夹角都是直角 减去∠BOE的结果,所以相等,由此可以证明△AEO≌△BFO; (2)由(1)知:∠OAC=∠OBF,∴∠BDA=∠AOB=90°,由此可以证明AE⊥BF 来源:2012-2013学年吉林省八年级上期中考试数学试卷(解析版) 考点:四边形 如图,在正方形ABCD中,E是AD的中点,F是BA延长线上的一点,AF=AB,已知△ABE≌△ADF. (1)在图中,可以通过平移、翻折、旋转中哪一种方法,使△ABE变到△ADF 的位置; (2)线段BE与DF有什么关系?证明你的结论. 【答案】 (1)绕点A旋转90°;(2)BE=DF,BE⊥DF. 【解析】本题考查的是旋转的性质,全等三角形的判断和性质 (1)根据旋转的概念得出; (2)根据旋转的性质得出△ABE≌△ADF,从而得出BE=DF,再根据正方形的性质得出BE⊥DF. (1)图中是通过绕点A旋转90°,使△ABE变到△ADF的位置. (2)BE=DF,BE⊥DF; 延长BE交DF于G; 《运筹学》试题样卷(一) 一、判断题(共计10分,每小题1分,对的打√,错的打X ) 1. 无孤立点的图一定是连通图。 2. 对于线性规划的原问题和其对偶问题,若其中一个有最优解, 另一个也一定有最优解。 3. 如果一个线性规划问题有可行解,那么它必有最优解。 4.对偶问题的对偶问题一定是原问题。 5.用单纯形法求解标准形式(求最小值)的线性规划问题时,与0 >j σ对应的变量都可以被选作换 入变量。 6.若线性规划的原问题有无穷多个最优解时,其对偶问题也有无穷 多个最优解。 7. 度为0的点称为悬挂点。 8. 表上作业法实质上就是求解运输问题的单纯形法。 9. 一个图G 是树的充分必要条件是边数最少的无孤立点的图。 二、建立下面问题的线性规划模型(8分) 某农场有100公顷土地及15000元资金可用于发展生产。农场劳动力情况为秋冬季3500人日;春夏季4000人日。如劳动力本身用不了时可外出打工,春秋季收入为25元 / 人日,秋冬季收入为20元 / 人日。该农场种植三种作物:大豆、玉米、小麦,并饲养奶牛和鸡。种作物时不需要专门投资,而饲养每头奶牛需投资800元,每只鸡投资3元。养奶牛时每头需拨出1.5公顷土地种饲料,并占用人工秋冬季为100人日,春夏季为50人日,年净收入900 元 / 每头奶牛。养鸡时不占用土地,需人工为每只鸡秋冬季0.6人日,春夏季为0.3人日,年净收入2元 / 每只鸡。农场现有鸡舍允许最多养1500 三、已知下表为求解某目标函数为极大化线性规划问题的最终单纯形表,表中54 ,x x 为松弛变量,问 (1)写出原线性规划问题;(4分) (2)写出原问题的对偶问题;(3分) (3)直接由上表写出对偶问题的最优解。(1分) 四、用单纯形法解下列线性规划问题(16分) s. t. 3 x1 + x2 + x3?60 x 1- x 2 +2 x 3?10 x 1+x 2-x 3?20 x 1,x 2 ,x 3?0 五、求解下面运输问题。(18分) 某公司从三个产地A1、A2、A3将物品运往四个销地B1、B2、B3、B4,各产地的产量、各销地的销量和各产地运往各销地每件物品的运费如表所示: 问:应如何调运,可使得总运输费最小? 六、灵敏度分析(共8分) 线性规划max z = 10x1 + 6x2 + 4x3 s.t. x1 + x2 + x3 ?100 10x1 +4 x2 + 5 x3 ?600 2x1 +2 x2 + 6 x3 ?300 x1 , x2 , x3 ?0 的最优单纯形表如下: (1)C1在何范围内变化,最优计划不变?(4分) (2)b1在什么范围内变化,最优基不变?(4分) 七、试建立一个动态规划模型。(共8分) 七年级下册初中数学知识点总结 第一章 整式的运算 一. 整式 ※1. 单项式 ①由数与字母的积组成的代数式叫做单项式。单独一个数或 字母也是单项式。 ②单项式的系数是这个单项式的数字因数,作为单项式的系数,必须连同数字前面的性质符号,如果一个单项式只是字母的积,并非没有系数. ③一个单项式中,所有字母的指数和叫做这个单项式的次数. ※2.多项式 ①几个单项式的和叫做多项式.在多项式中,每个单项式叫做多 项式的项.其中,不含字母的项叫做常数项.一个多项式中,次 数最高项的次数,叫做这个多项式的次数. ②单项式和多项式都有次数,含有字母的单项式有系数,多项式 没有系数.多项式的每一项都是单项式,一个多项式的项数就 是这个多项式作为加数的单项式的个数.多项式中每一项都有 它们各自的次数,但是它们的次数不可能都作是为这个多项式 的次数,一个多项式的次数只有一个,它是所含各项的次数中 最高的那一项次数. ※3.整式单项式和多项式统称为整式. ????????其他代数式多项式单项式整式代数式 二. 整式的加减 ¤1. 整式的加减实质上就是去括号后,合并同类项,运算结果是一个多项式或是单项式. ¤2. 括号前面是“-”号,去括号时,括号内各项要变号,一个 数与多项式相乘时,这个数与括号内各项都要相乘. 三. 同底数幂的乘法 ※同底数幂的乘法法则: n m n m a a a +=?(都是正数)是幂的运算中最 基本的法则,在应用法则运算时,要注意以下几点: ①法则使用的前提条件是:幂的底数相同而且是相乘时,底数a 可以是一个具体的数字式字母,也可以是一个单项或多项式; ②指数是1时,不要误以为没有指数; ③不要将同底数幂的乘法与整式的加法相混淆,对乘法,只要底 运筹学期末试卷(B卷) 系别:工商管理学院专业:考试日期:年月日姓名:学号:成绩: 1.[10分] 匹克公司要安排4个工人去做4项不同的工作,每个工人完成各项工作所消耗的时间(单位:分钟)如下表所示: 要求:(1)建立线性规划模型(只建模型,不求解) (2)写出基于Lindo软件的源程序。 2.[15分]某公司下属甲、乙两个厂,有A原料360斤,B原料640斤。甲厂用A、B两种原料生产x1,x2两种产品,乙厂也用A、B两种原料生产x3,x4两种产品。每种单位产品所消耗各种原料的数量及产值、分配等如下 (1) 建立规划模型获取各厂最优生产计划。 (2) 试用图解法 求解最优结果。 3.[10分] 考虑下面的线性规划问题: 目标函数:Min Z=16x 1+16x 2 +17x 3 约束条件: 利用教材附带软件求解如下: **********************最优解如下************************* 目标函数最优值为 : 148.916 变量 最优解 相差值 ------- -------- -------- x1 7.297 0 x2 0 .703 x3 1.892 0 约束 松弛/剩余变量 对偶价格 ------- ------------- -------- 13123123123300.56153420,,0 x x x x x x x x x x x +≤-+≥+-≥≥ 1 20.811 0 2 0 -3.622 3 0 -4.73 目标函数系数范围: 变量下限当前值上限 ------- -------- -------- -------- x1 1.417 16 16.565 x2 15.297 16 无上限 x3 14.4 17 192 常数项数范围: 约束下限当前值上限 ------- -------- -------- -------- 1 9.189 30 无上限 2 3.33 3 15 111.25 3 -2.5 20 90 试回答下列问题: (1)第二个约束方程的对偶价格是一个负数(为-3.622),它的含义是什么? (2)x2有相差值为0.703,它的含义是什么? (3)请对右端常数项范围的上、下限给予具体解释,应如何应用这些数 2014-2015学年度配套中学教材全解七年级数学(下)(北京课改版) 期末检测题附答案详解 (本检测题满分:120分,时间:120分钟) 一、选择题(每小题3分,共36分) 1.若不等式组 12 x x m ì ?? , 有解,则m的取值范围是() A.m<2 B.m≥2 C.m<1 D.1≤m<2 2.(2014?南充中考)不等式组 () 1 12, 2 331 x x x ì? ?+? ?í ?? -<+ ?? 的解集在数轴上表示正确的是() A.B.C.D. 3.若方程组 2313, 3530.9 a b a b ì- ?? í? + ?? = = 的解是 8.3, 1.2, a b ì?? í? ?? = = 则方程组 ()() ()() 223113, 325130.9 x y x y ì+-- ?? í? ++- ?? = = 的解是() A. 6.3, 2.2 x y ì?? í? ?? = = B. .3, .2 x y ì?? í? ?? =8 =1 C. 10.3, 2.2 x y ì?? í? ?? = = D. 10.3, 0.2 x y ì?? í? ?? = = 4.下列语句:①一条直线有且只有一条垂线;②不相等的两个角一定不是对顶角;③两条不相交的直线叫做平行线;④若两个角的一对边在同一直线上,另一对边互相平行,则这两个角相等;⑤不在同一直线上的四个点可画6条直线;⑥如果两个角是邻补角,那么这两个角的平分线组成的图形是直角.其中错误的有() A.2个 B.3个 C.4个 D.5个 5.某中学课外科技小组的同学们设计制作了一个电动智能玩具,玩具中的四个动物小鱼、小羊、燕子和熊猫分别在1、2、3、4号位置上(如图),玩具的程序是:让四个动物按图中所示的规律变换位置,第一次上、下两排交换位置;第二次是在第一次换位后,再左、右两列交换位置;第三次再上、下两排交换位置;第四次再左、右两列交换位置;按这种规律,一直交换下去,那么第2 008次交换位置后,熊猫所在位置的号码是() A.1号 B.2号 C.3号 D.4号 6.如图,直线a和直线b被直线c所截,给出下列条件: 第5题图 《管理运筹学》期末考试试题 一、单项选择题(共5小题,每小题3分,共15分) 1.如果一个线性规划问题有n个变量,m个约束方程(m 3. 写出下面线性规划问题的对偶问题: 123123123123123min z 25, 258, 23 3,.. 4 26, ,,0. x x x x x x x x x s t x x x x x x =++-+≤??++=??-+≤??≥? 四、计算下列各题(每题20分,合计40分) 1. 用单纯形法求解下列线性规划的最优解: 012121212max 2..32250,0x x x s t x x x x x x =+??≤??≤??+≤??≥≥? 2.用割平面法求解整数规划问题。 12 121212 max 7936735,0,z x x x x x x x x =+-+≤??+≤??≥?且为整数 第十四章实数 (2) 第一节平方根 (2) 第二节立方根 (6) 第三节实数 (8) 中考链接 (11) 单元检测 (12) 第十五章不等式与不等式组 (15) 第一节不等式 (15) 第二节实际问题与一元一次不等式 (17) 第三节一元一次不等式组 (19) 中考链接 (21) 单元检测 (23) 第十六章数据的分析 (26) 第一节数据的代表 (26) 第二节数据的波动 (29) 中考链接 (31) 单元检测 (33) 第十七章三角形 (37) 第一节与三角形有关的线段 (37) 第二节与三角形有关的角 (40) 第三节多边形及其内角和 (44) 中考链接 (47) 单元检测 (49) 第十八章全等三角形 (52) 第一节全等三角形 (52) 第二节三角形全等的条件 (55) 第三节角的平分线的性质 (59) 中考链接 (65) 单元检测 (68) 期中试卷 (72) 期末试卷 (75) 参考答案 (78) 第十四章实数 单元目标 1. 理解平方根、立方根的概念和性质; 2. 掌握算术平方根,算术平方根的非负性的应用. 3. 理解无理数和实数的概念以及有理数和无理数的区别; 4. 掌握实数和数轴上的点的关系,平面直角坐标系中的点和有序实数对之间的关系. 第一节平方根 要点精讲 1、算术平方根 一般地,如果一个正数x的平方等于a,即x2=a,那么这个正数x叫做a的算术平方根. a的算术平方根记为,读作“根号a”,a叫被开方数. 0的算术平方根是0. 2、用计算器求一个数的算术平方根 有的计算器上有“”键,就可以使用这个键直接求出一个数的算术平方根. 3、平方根 一般地,如果一个数的平方等于a,那么这个数叫做a的平方根(或二次方根),这就是说:如果x2=a,那么x叫做a的平方根. 4、开平方 求一个数a的平方根的运算,叫做开平方. 5、平方根的性质 正数有两个平方根,它们互为相反数; 0的平方根是0; 负数没有平方根. 6、平方根的表示 正数a的算术平方根用表示; 正数a的负的平方根用表示; 正数a的平方根用符号表示. 7、平方根重要性质: (1)a≥0时,;【免费下载】中学教材全解 七年级数学上北师大版期末检测题含答案
新人教版七年级下册数学知识点整理
管理运筹学模拟试题及答案
(完整版)七年级下册数学知识结构图
WebofKnowledge平台定题服务功能使用简介
管理运筹学模拟试题附答案
七年级数学下册全部知识点归纳
(完整word版)北师大版七年级数学下册三角形难题全解
《运筹学》期末考试试卷A答案
七年级下册初中数学知识点总结
管理运筹学期末试卷题目B卷
苏科版数学七年级下册-配套中学教材全解(北京课.doc
《管理运筹学》期末考试试题
天津新人教五四制数学七年级下册同步全解